🚀 $NVDA LONG TRADE SETUP – Bulls Preparing for a Recovery?
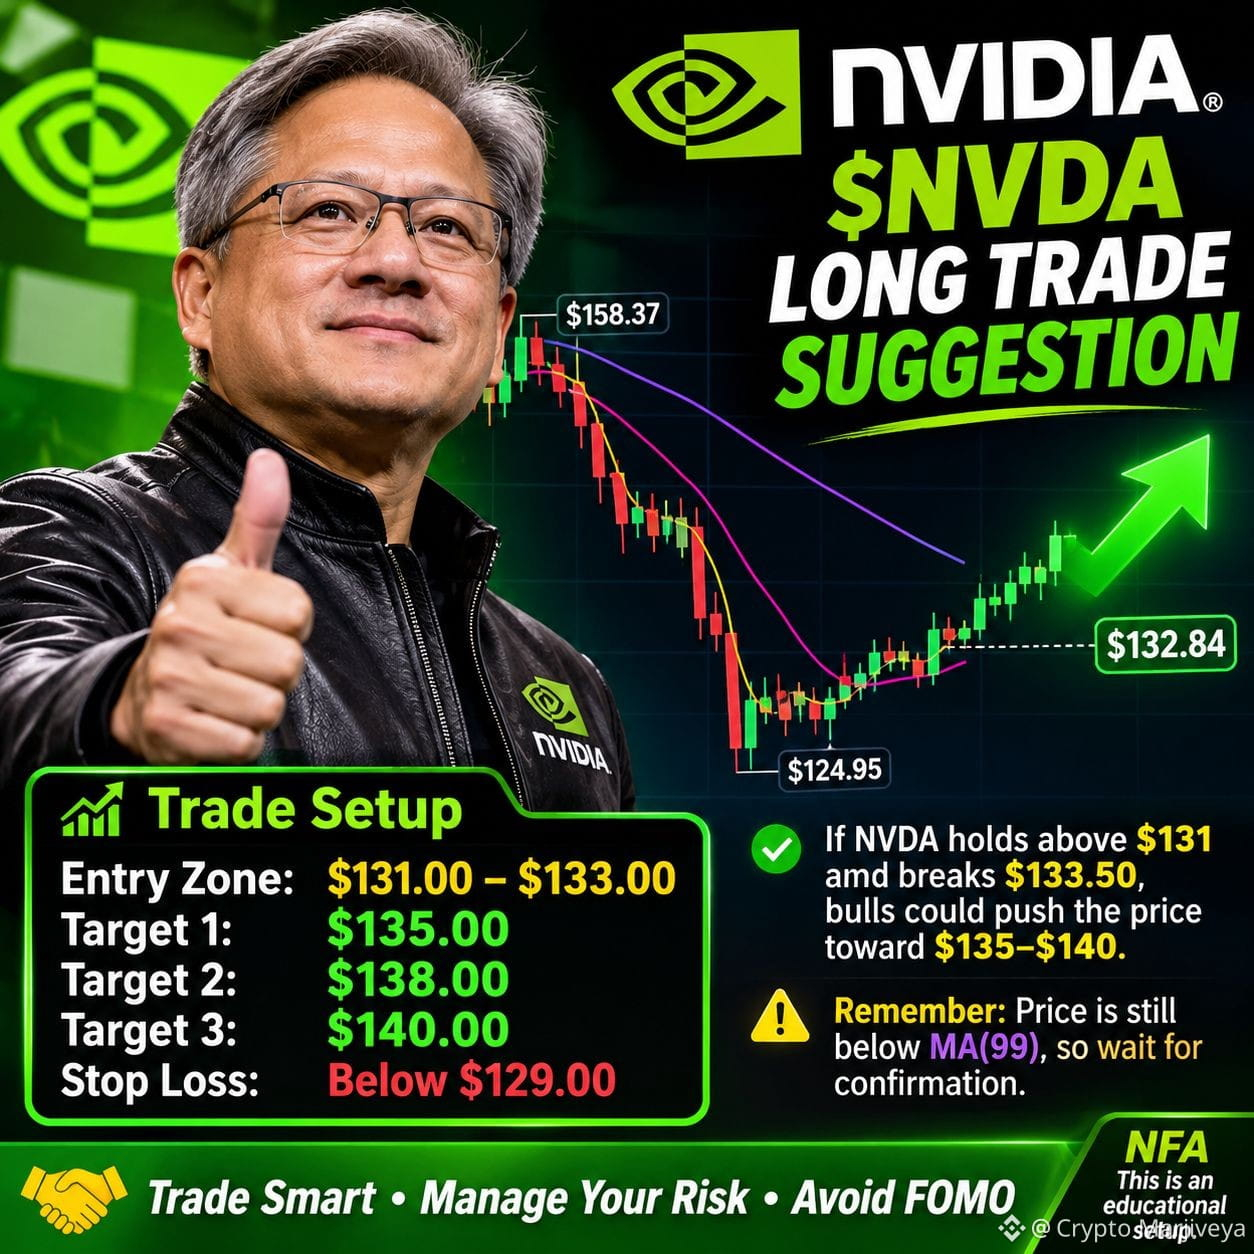
$NVDA .US is showing signs of short-term recovery after a sharp sell-off from $158.37 to $124.95.
📊 Technical Analysis (1H Chart):
- Current Price: $132.84
- MA(7): $132.92
- MA(25): $131.38
- MA(99): $139.94
🎯 Key Levels:
- Entry Zone: $131.00–$133.00
- Target 1: $135.00
- Target 2: $138.00
- Target 3: $140.00
- Stop Loss: Below $129.00
📈 Bullish Scenario:
If NVDA holds above $131 and breaks through $133.50 with strong volume, buyers could push the price toward $135–$140.
⚠️ Important: The broader trend remains bearish because price is still below MA(99). Wait for confirmation before entering.
Trade smart. Manage your risk. Avoid FOMO.
#NVDA #longtrade #cryptotrading #Binance #GlobalStocksFaceLongestLosingStreakSince2023
NFA – This is an educational setup, not a guaranteed trade.
$NVDA .US is showing signs of short-term recovery after a sharp sell-off from $158.37 to $124.95.
📊 Technical Analysis (1H Chart):
- Current Price: $132.84
- MA(7): $132.92
- MA(25): $131.38
- MA(99): $139.94
🎯 Key Levels:
- Entry Zone: $131.00–$133.00
- Target 1: $135.00
- Target 2: $138.00
- Target 3: $140.00
- Stop Loss: Below $129.00
📈 Bullish Scenario:
If NVDA holds above $131 and breaks through $133.50 with strong volume, buyers could push the price toward $135–$140.
⚠️ Important: The broader trend remains bearish because price is still below MA(99). Wait for confirmation before entering.
Trade smart. Manage your risk. Avoid FOMO.
#NVDA #longtrade #cryptotrading #Binance #GlobalStocksFaceLongestLosingStreakSince2023
NFA – This is an educational setup, not a guaranteed trade.