$DODO: When Crowd Attention Meets Local Resistance
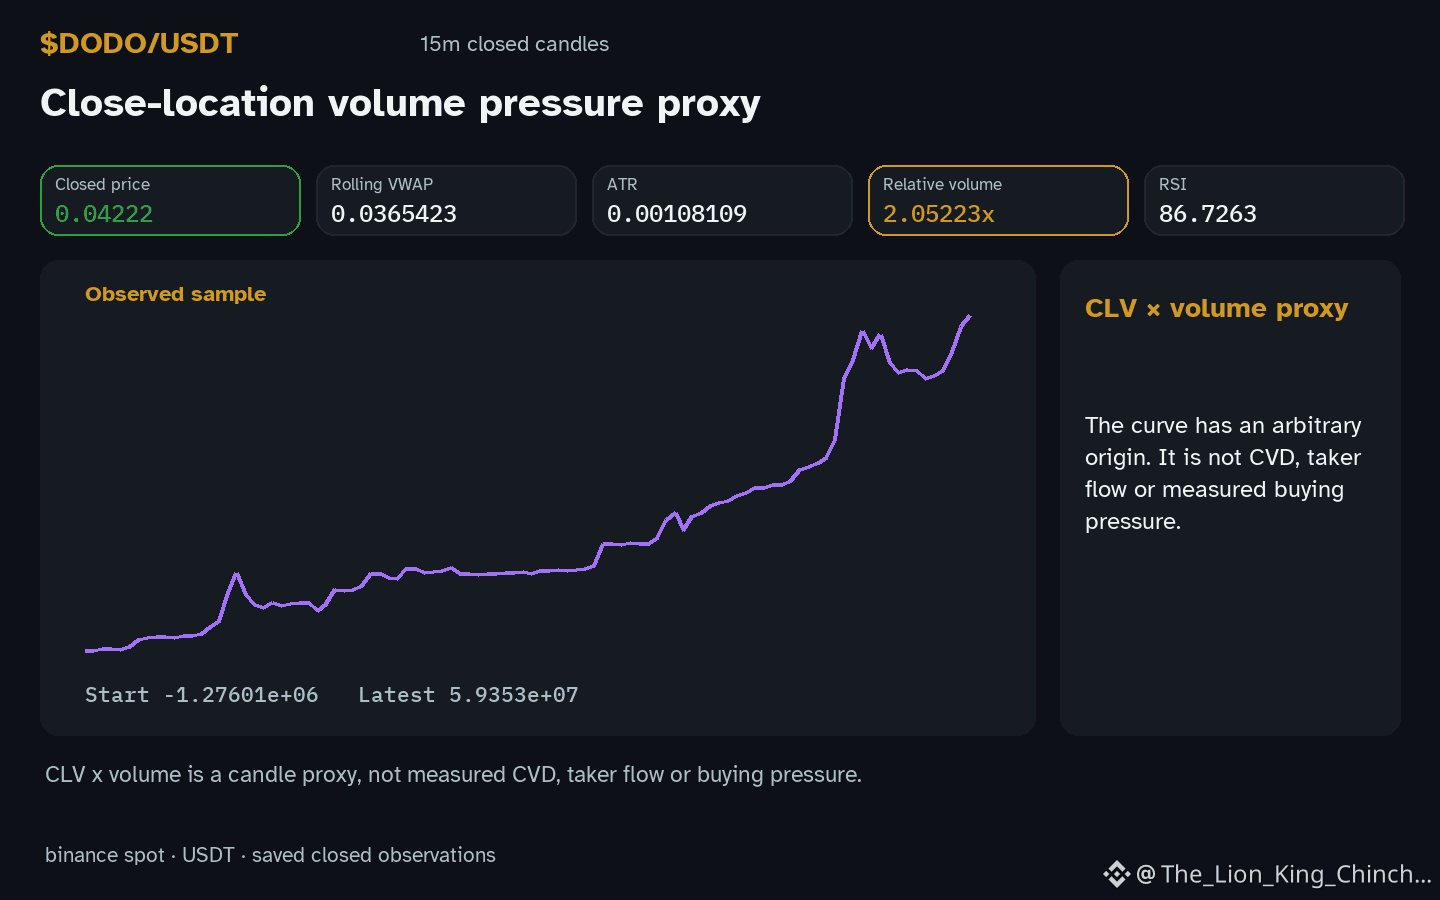
Does $DODO momentum reflect genuine strength or just peak attention near overhead supply? With price above resistance and hourly direction up while relative volume sits at 2.05x baseline, the setup invites a psychological check.
The Bandwagon Trap
People often assume that crowded participation confirms a trend. In reality, high social interest can peak right where orders are thin. If new buyers arrive exactly at 0.04146, their enthusiasm becomes the exit liquidity for earlier holders. This is not proof of actual trader motives. It is a hypothetical mechanism. The current relative volume, 2.05x baseline, shows activity compared to recent bars. It does not reveal hidden stops, order flow, or permanent breakout power.
The Counterexample
If $DODO holds above this local range after follow-through, the initial move may not be a trap. The price might simply clear old supply. Conversely, if price rejects at 0.04146 and drifts back down, the earlier surge could have only attracted latecomers. This shows why checking the full picture matters more than focusing on one popular chart signal.
What Could Change the Reading
Watch the next few closed candles. If price stays above 0.04146 with sustained relative volume, the short bias weakens. If it falls back below that level, the enthusiasm thesis gains support. Treat the current RSI of 86.7 as a relative temperature gauge, not a promise of reversal. Your self-check is simple: are you acting because you lost patience during the move, or because new price evidence changed your plan?
The observation stands as a conditional risk. The crowd bias here is the danger of acting on the loudest narrative. Use the structural level as your only guide.
Probabilistic market research, not a recommendation or guaranteed return.
#DODO #TradingPsychology
Does $DODO momentum reflect genuine strength or just peak attention near overhead supply? With price above resistance and hourly direction up while relative volume sits at 2.05x baseline, the setup invites a psychological check.
The Bandwagon Trap
People often assume that crowded participation confirms a trend. In reality, high social interest can peak right where orders are thin. If new buyers arrive exactly at 0.04146, their enthusiasm becomes the exit liquidity for earlier holders. This is not proof of actual trader motives. It is a hypothetical mechanism. The current relative volume, 2.05x baseline, shows activity compared to recent bars. It does not reveal hidden stops, order flow, or permanent breakout power.
The Counterexample
If $DODO holds above this local range after follow-through, the initial move may not be a trap. The price might simply clear old supply. Conversely, if price rejects at 0.04146 and drifts back down, the earlier surge could have only attracted latecomers. This shows why checking the full picture matters more than focusing on one popular chart signal.
What Could Change the Reading
Watch the next few closed candles. If price stays above 0.04146 with sustained relative volume, the short bias weakens. If it falls back below that level, the enthusiasm thesis gains support. Treat the current RSI of 86.7 as a relative temperature gauge, not a promise of reversal. Your self-check is simple: are you acting because you lost patience during the move, or because new price evidence changed your plan?
The observation stands as a conditional risk. The crowd bias here is the danger of acting on the loudest narrative. Use the structural level as your only guide.
Probabilistic market research, not a recommendation or guaranteed return.
#DODO #TradingPsychology