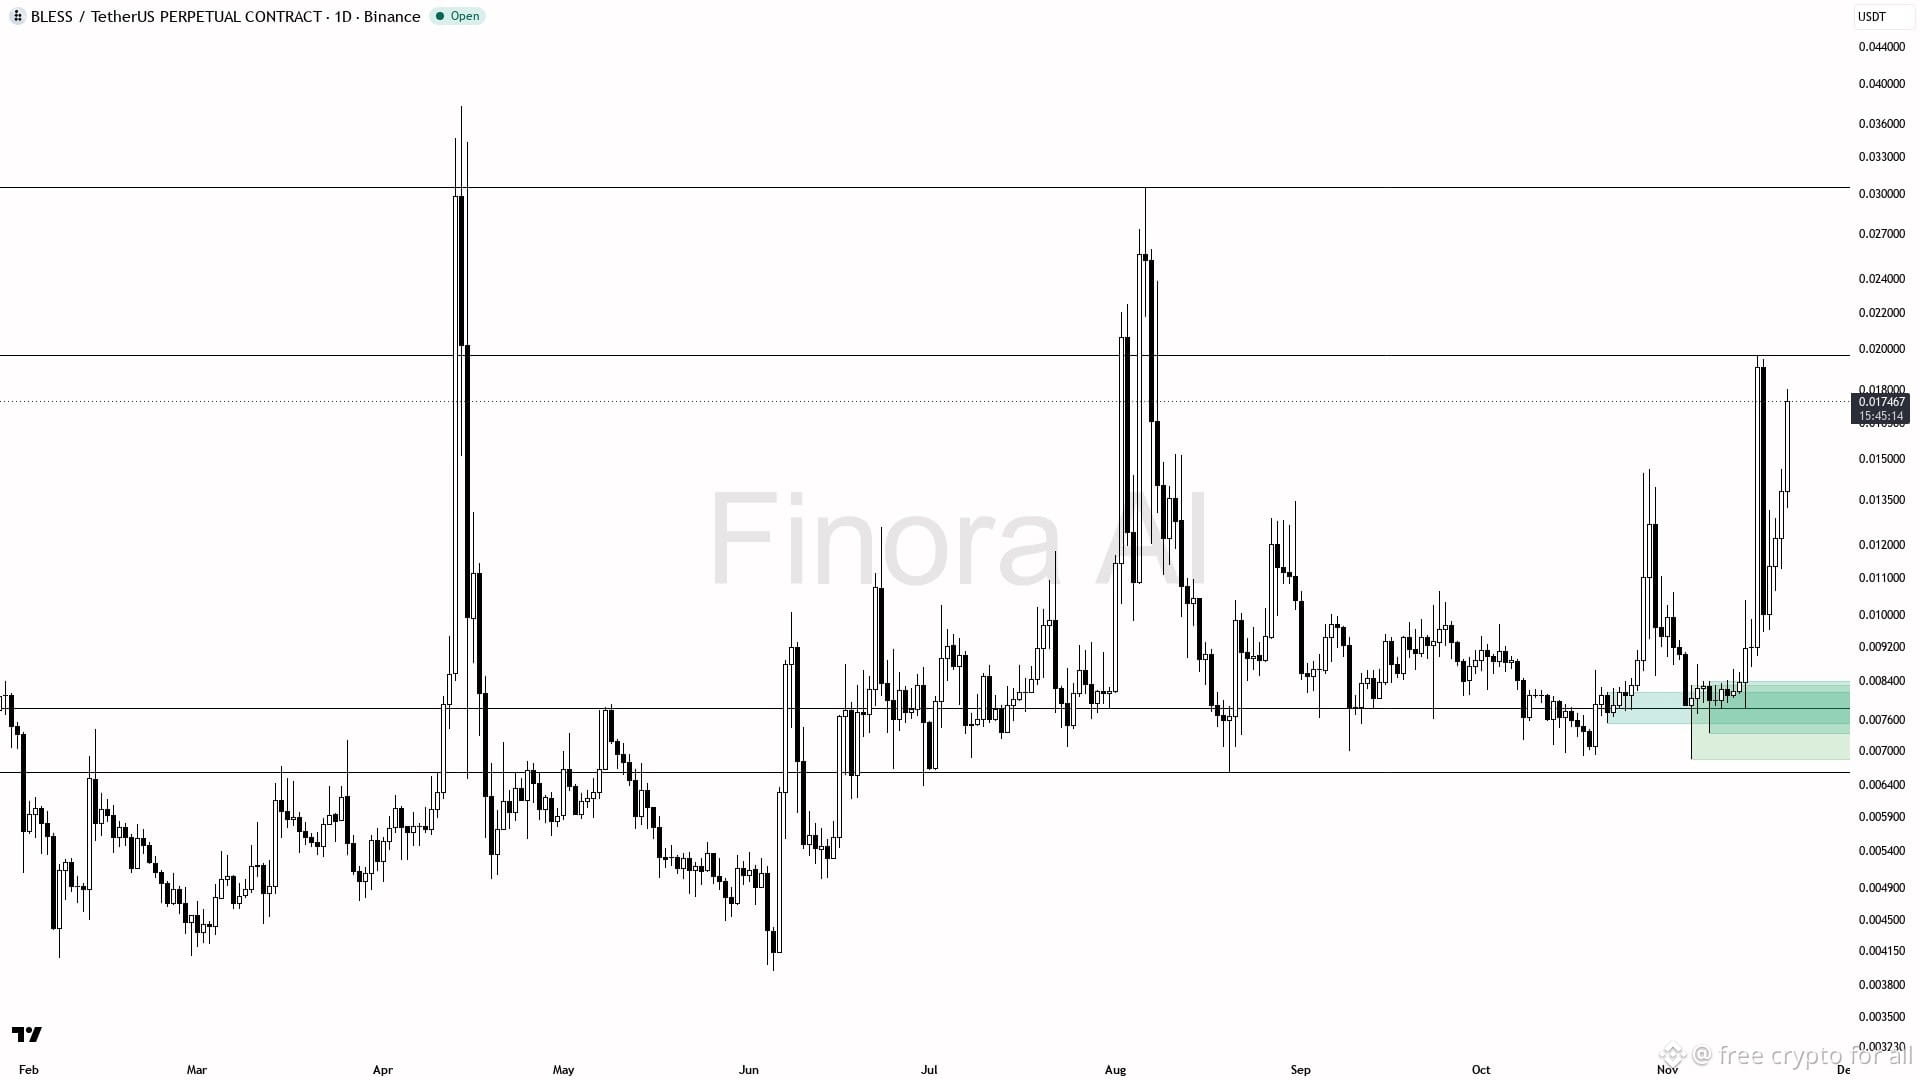
📊 BLESSUSDT.P · 1D
- The 1D structure is bullish, with price at 0.017477 above the EMA20 and EMA200; the daily indicator directions also broadly support that trend. The weekly structure is ranging, however, and bearish BTC makes this altcoin long counter to its benchmark’s trend, so I want clear price confirmation.
- The latest closed daily candle finished at 0.013779, while the open candle is trading around 0.014597 on the price-action view; it has not confirmed a close above nearby resistance. Open interest has expanded sharply and funding is positive, with longs paying shorts, so crowded positioning raises the risk of a pullback before continuation.
- My long setup is a pullback entry zone at 0.01070–0.01130, near mapped support. Wait for price to hold this zone and show a bullish daily rejection or reclaim before entering; if price reaches 0.018894 before visiting the entry zone, the plan is missed.
- Take-profit levels are 0.014597, 0.018894, 0.019690, then 0.021425–0.022392, with 0.027454 as the farther mapped target. From the entry zone, the first target is above entry and the farther targets offer additional room.
- Support below price is mapped around 0.011301, 0.010704, 0.009999, 0.008472–0.008173 and 0.007206; 0.006853 is the confirmed swing-low liquidity edge, not an entry level. Place protection beyond the structural flip level.
- A 1D close below 0.006853 flips my bullish view to bearish; until then, I favor continuation after a confirmed pullback hold.
📝 Not investment advice — an educational report.
📊 Flow: OI $17.9M (+40.2% 24h) · funding +0.0513% · taker 0.97× $BLESS
$BTC
#CanBTCReboundAfterFallingBelow60K? #GlobalStocksFaceLongestLosingStreakSince2023
- The 1D structure is bullish, with price at 0.017477 above the EMA20 and EMA200; the daily indicator directions also broadly support that trend. The weekly structure is ranging, however, and bearish BTC makes this altcoin long counter to its benchmark’s trend, so I want clear price confirmation.
- The latest closed daily candle finished at 0.013779, while the open candle is trading around 0.014597 on the price-action view; it has not confirmed a close above nearby resistance. Open interest has expanded sharply and funding is positive, with longs paying shorts, so crowded positioning raises the risk of a pullback before continuation.
- My long setup is a pullback entry zone at 0.01070–0.01130, near mapped support. Wait for price to hold this zone and show a bullish daily rejection or reclaim before entering; if price reaches 0.018894 before visiting the entry zone, the plan is missed.
- Take-profit levels are 0.014597, 0.018894, 0.019690, then 0.021425–0.022392, with 0.027454 as the farther mapped target. From the entry zone, the first target is above entry and the farther targets offer additional room.
- Support below price is mapped around 0.011301, 0.010704, 0.009999, 0.008472–0.008173 and 0.007206; 0.006853 is the confirmed swing-low liquidity edge, not an entry level. Place protection beyond the structural flip level.
- A 1D close below 0.006853 flips my bullish view to bearish; until then, I favor continuation after a confirmed pullback hold.
📝 Not investment advice — an educational report.
📊 Flow: OI $17.9M (+40.2% 24h) · funding +0.0513% · taker 0.97× $BLESS
$BTC
#CanBTCReboundAfterFallingBelow60K? #GlobalStocksFaceLongestLosingStreakSince2023