DAILY SIGNAL — SOL/USDT
Date: 21 Nov 2026
Timeframe: 1m
Intraday Bias: Rejection from higher levels → testing lower Fibonacci supports
📊 MARKET BIAS
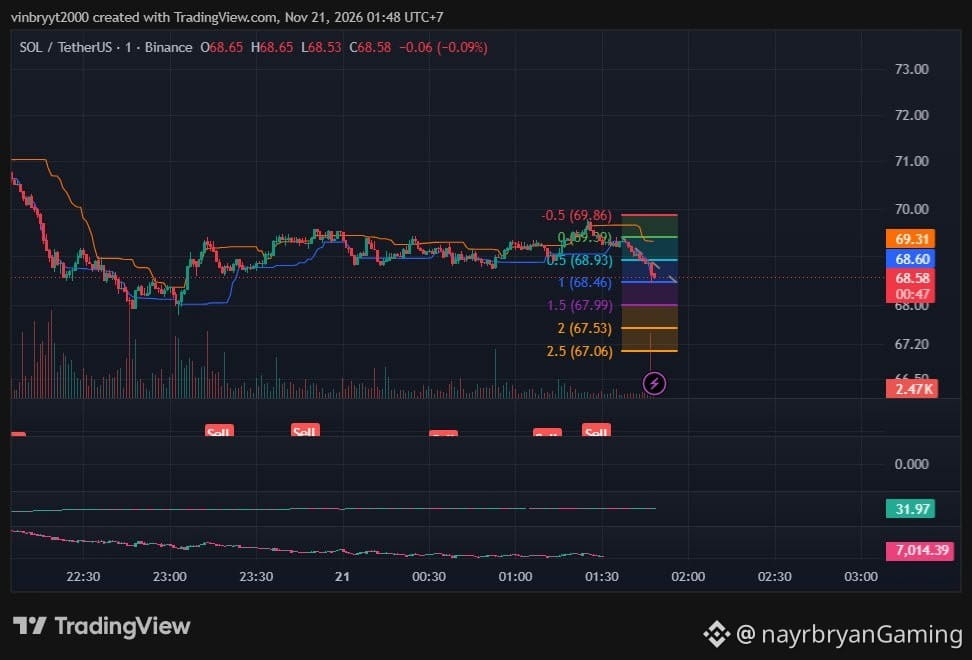
SOL is trading around 68.58 after failing to hold above the 0 Fibonacci level at 68.93.
Price has been consolidating beneath the orange resistance line and has now slipped lower, currently pressing toward the 0.5 Fib at 68.46. Multiple “Sell” markers appear on the chart, reflecting repeated rejection attempts near the upper range.
The structure shows a series of lower highs, with price now trading below both the blue and orange short-term guides. As long as price remains below 68.93–69.00, the path of least resistance stays downward toward the next Fibonacci supports.
A strong reclaim of 68.93 would be needed to neutralize the immediate bearish pressure.
🔹 KEY LEVELS FROM CHART
Current Price: 68.58
Immediate Resistance: 68.93 – 69.00 (0 Fib)
Major Resistance: 69.86 (-0.5 Fib)
Key Support Levels: 68.46 (0.5 Fib) → 67.99 (1.0 Fib)
Fibonacci Extension Reference: 67.06 (2.0 Fib)
🎯 FIBONACCI LEVELS
Potential Downside Levels:
TP1 → 68.46 (0.5 Fib)
TP2 → 67.99 (1.0 Fib)
TP3 → 67.53 (1.5 Fib)
TP4 → 67.06 (2.0 Fib)
Upside Recovery Reference:
68.93 → 69.86
These are chart-derived reference levels, not guaranteed targets.
🧠 QUICK INSIGHT
“When price loses the 0 Fib and the short-term guides, the next supports become the map — not the hope of a quick reclaim.”
⚠️ DISCLAIMER
This is personal chart analysis for educational purposes only, not financial advice.
Always DYOR / DYODD, manage risk responsibly, and wait for confirmation before making trading decisions.
— @nayrbryanGaming
#SOL #SOLUSDT #Binance #CryptoTrading #TechnicalAnalysis #PriceAction #Fibonacci #TradingView #DYOR #NFA #NoFOMO
Date: 21 Nov 2026
Timeframe: 1m
Intraday Bias: Rejection from higher levels → testing lower Fibonacci supports
📊 MARKET BIAS
SOL is trading around 68.58 after failing to hold above the 0 Fibonacci level at 68.93.
Price has been consolidating beneath the orange resistance line and has now slipped lower, currently pressing toward the 0.5 Fib at 68.46. Multiple “Sell” markers appear on the chart, reflecting repeated rejection attempts near the upper range.
The structure shows a series of lower highs, with price now trading below both the blue and orange short-term guides. As long as price remains below 68.93–69.00, the path of least resistance stays downward toward the next Fibonacci supports.
A strong reclaim of 68.93 would be needed to neutralize the immediate bearish pressure.
🔹 KEY LEVELS FROM CHART
Current Price: 68.58
Immediate Resistance: 68.93 – 69.00 (0 Fib)
Major Resistance: 69.86 (-0.5 Fib)
Key Support Levels: 68.46 (0.5 Fib) → 67.99 (1.0 Fib)
Fibonacci Extension Reference: 67.06 (2.0 Fib)
🎯 FIBONACCI LEVELS
Potential Downside Levels:
TP1 → 68.46 (0.5 Fib)
TP2 → 67.99 (1.0 Fib)
TP3 → 67.53 (1.5 Fib)
TP4 → 67.06 (2.0 Fib)
Upside Recovery Reference:
68.93 → 69.86
These are chart-derived reference levels, not guaranteed targets.
🧠 QUICK INSIGHT
“When price loses the 0 Fib and the short-term guides, the next supports become the map — not the hope of a quick reclaim.”
⚠️ DISCLAIMER
This is personal chart analysis for educational purposes only, not financial advice.
Always DYOR / DYODD, manage risk responsibly, and wait for confirmation before making trading decisions.
— @nayrbryanGaming
#SOL #SOLUSDT #Binance #CryptoTrading #TechnicalAnalysis #PriceAction #Fibonacci #TradingView #DYOR #NFA #NoFOMO