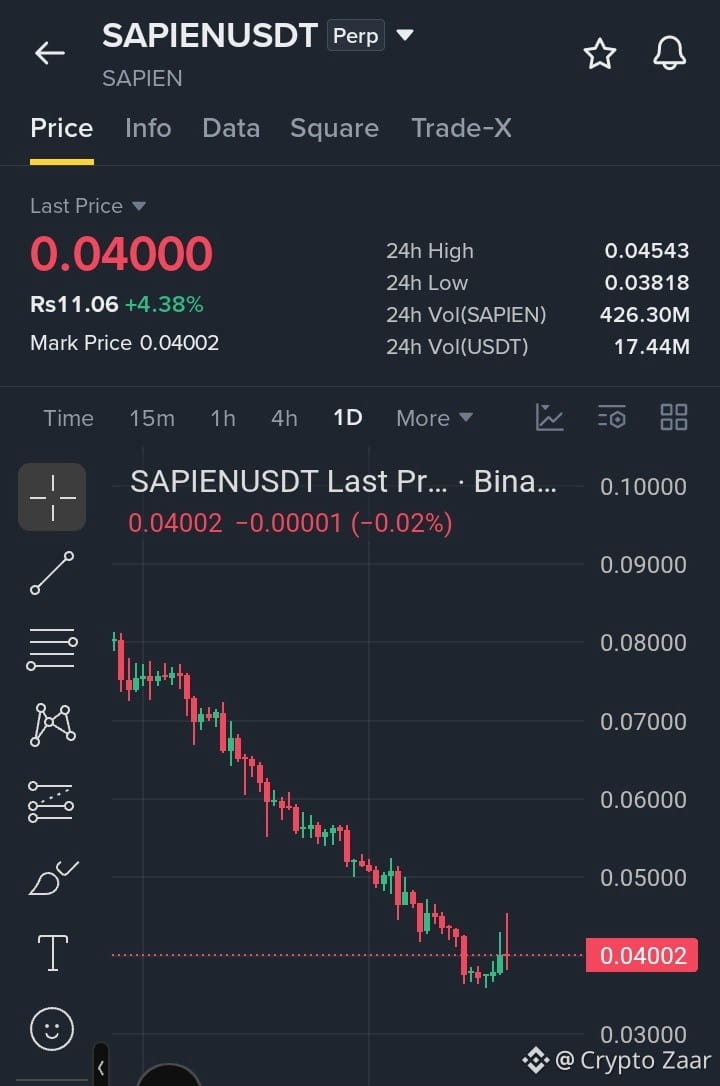
$SAPIEN USDT – BEARISH REVERSAL OR CONTINUED SELLING PRESSURE?
SAPIEN is showing signs of weakness after facing rejection from higher levels. The broader chart structure suggests sellers could regain control if the price fails to reclaim nearby resistance. A breakdown below support may trigger another downward move.
SHORT ENTRY: 0.04000 – 0.04080
STOP LOSS: 0.04320
TAKE PROFIT TARGETS: TP1: 0.03820 TP2: 0.03650 TP3: 0.03400
INVALIDATION: A strong breakout above 0.04320 could weaken the bearish setup.
RISK MANAGEMENT: Keep leverage low, use a strict stop loss, and secure partial profits at each target.
$ZEC $KERNEL
SAPIEN is showing signs of weakness after facing rejection from higher levels. The broader chart structure suggests sellers could regain control if the price fails to reclaim nearby resistance. A breakdown below support may trigger another downward move.
SHORT ENTRY: 0.04000 – 0.04080
STOP LOSS: 0.04320
TAKE PROFIT TARGETS: TP1: 0.03820 TP2: 0.03650 TP3: 0.03400
INVALIDATION: A strong breakout above 0.04320 could weaken the bearish setup.
RISK MANAGEMENT: Keep leverage low, use a strict stop loss, and secure partial profits at each target.
$ZEC $KERNEL