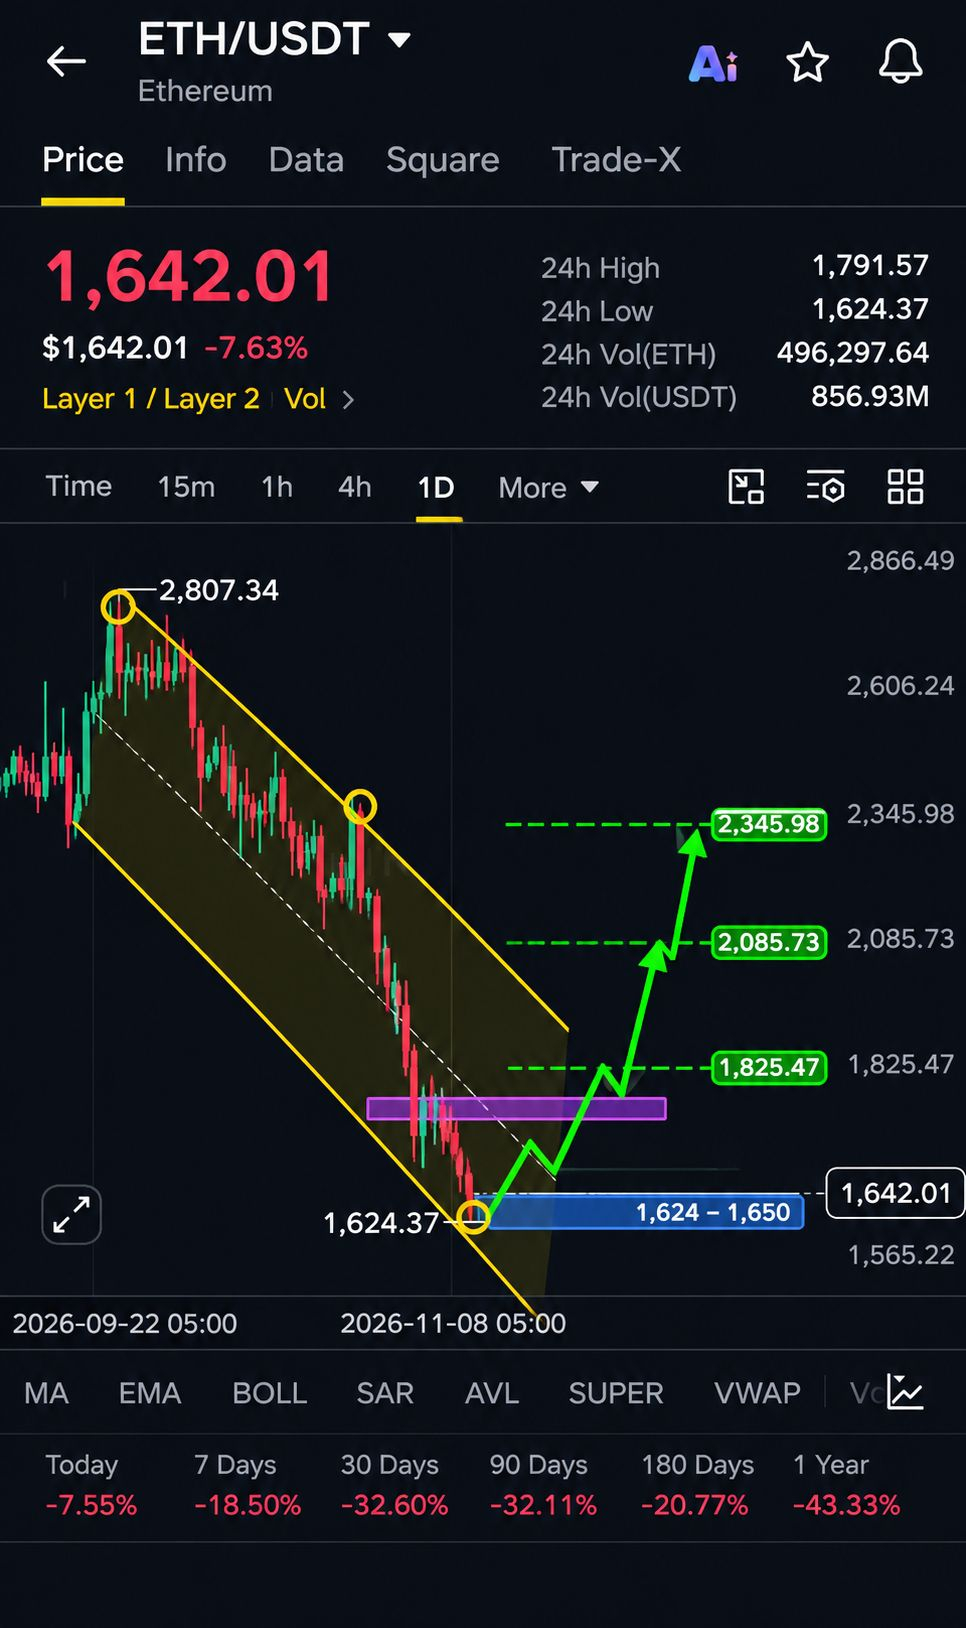
$ETH Ethereum Tests a Major Demand Zone as a Recovery Setup Emerges
Long Setup
Entry Zone: 1,624–1,650
Stop Loss: 1,565
TP1: 1,825.47
TP2: 2,085.73
TP3: 2,345.98
Market Structure Analysis
Ethereum is approaching a critical turning point after an extended bearish phase that pushed price down from the 2,807.34 region. The daily chart continues to show a descending channel, with sellers maintaining control through a sequence of lower highs and lower lows.
However, the recent decline has brought ETH into an important demand zone between 1,624 and 1,650. Price has reacted around this region, making it a key area to watch for a potential reversal.
The Recovery Scenario
The first major challenge for buyers is the descending channel resistance, followed by the purple supply zone around 1,750–1,780.
A decisive daily candle close above this resistance area, supported by stronger trading volume, could provide the first meaningful confirmation of a bullish recovery.
If buyers successfully reclaim this region, the 1,825.47 level becomes the first major upside objective.
Bullish Price Targets
TP1: 1,825.47
TP2: 2,085.73
TP3: 2,345.98
These Fibonacci-based objectives represent potential recovery milestones if bullish momentum continues to develop.
Trading Strategy
The 1,624–1,650 demand zone is the primary area to monitor for buyer activity. A successful defense of this support, followed by a breakout above descending resistance, could create an attractive recovery opportunity.
A breakdown below 1,565 would invalidate this bullish setup and increase the risk of further downside.
Final Outlook
Ethereum is trading near a significant technical support area after a prolonged decline. The next important development will be whether buyers can turn this demand zone into the foundation of a broader recovery.
A confirmed breakout could shift market sentiment and bring the higher Fibonacci targets into focus.
Patience, confirmation and proper risk management remain essential.
Long Setup
Entry Zone: 1,624–1,650
Stop Loss: 1,565
TP1: 1,825.47
TP2: 2,085.73
TP3: 2,345.98
Market Structure Analysis
Ethereum is approaching a critical turning point after an extended bearish phase that pushed price down from the 2,807.34 region. The daily chart continues to show a descending channel, with sellers maintaining control through a sequence of lower highs and lower lows.
However, the recent decline has brought ETH into an important demand zone between 1,624 and 1,650. Price has reacted around this region, making it a key area to watch for a potential reversal.
The Recovery Scenario
The first major challenge for buyers is the descending channel resistance, followed by the purple supply zone around 1,750–1,780.
A decisive daily candle close above this resistance area, supported by stronger trading volume, could provide the first meaningful confirmation of a bullish recovery.
If buyers successfully reclaim this region, the 1,825.47 level becomes the first major upside objective.
Bullish Price Targets
TP1: 1,825.47
TP2: 2,085.73
TP3: 2,345.98
These Fibonacci-based objectives represent potential recovery milestones if bullish momentum continues to develop.
Trading Strategy
The 1,624–1,650 demand zone is the primary area to monitor for buyer activity. A successful defense of this support, followed by a breakout above descending resistance, could create an attractive recovery opportunity.
A breakdown below 1,565 would invalidate this bullish setup and increase the risk of further downside.
Final Outlook
Ethereum is trading near a significant technical support area after a prolonged decline. The next important development will be whether buyers can turn this demand zone into the foundation of a broader recovery.
A confirmed breakout could shift market sentiment and bring the higher Fibonacci targets into focus.
Patience, confirmation and proper risk management remain essential.