Is this the $ETH bottom, or just an elaborate shakeout before the next leg up? 🔥
$ETH's 4H chart is testing a critical support zone around $1,730 while under heavy Ichimoku Cloud resistance.
Alright team, let's break down this juicy $ETH chart and see what's cooking!
Technical Analysis
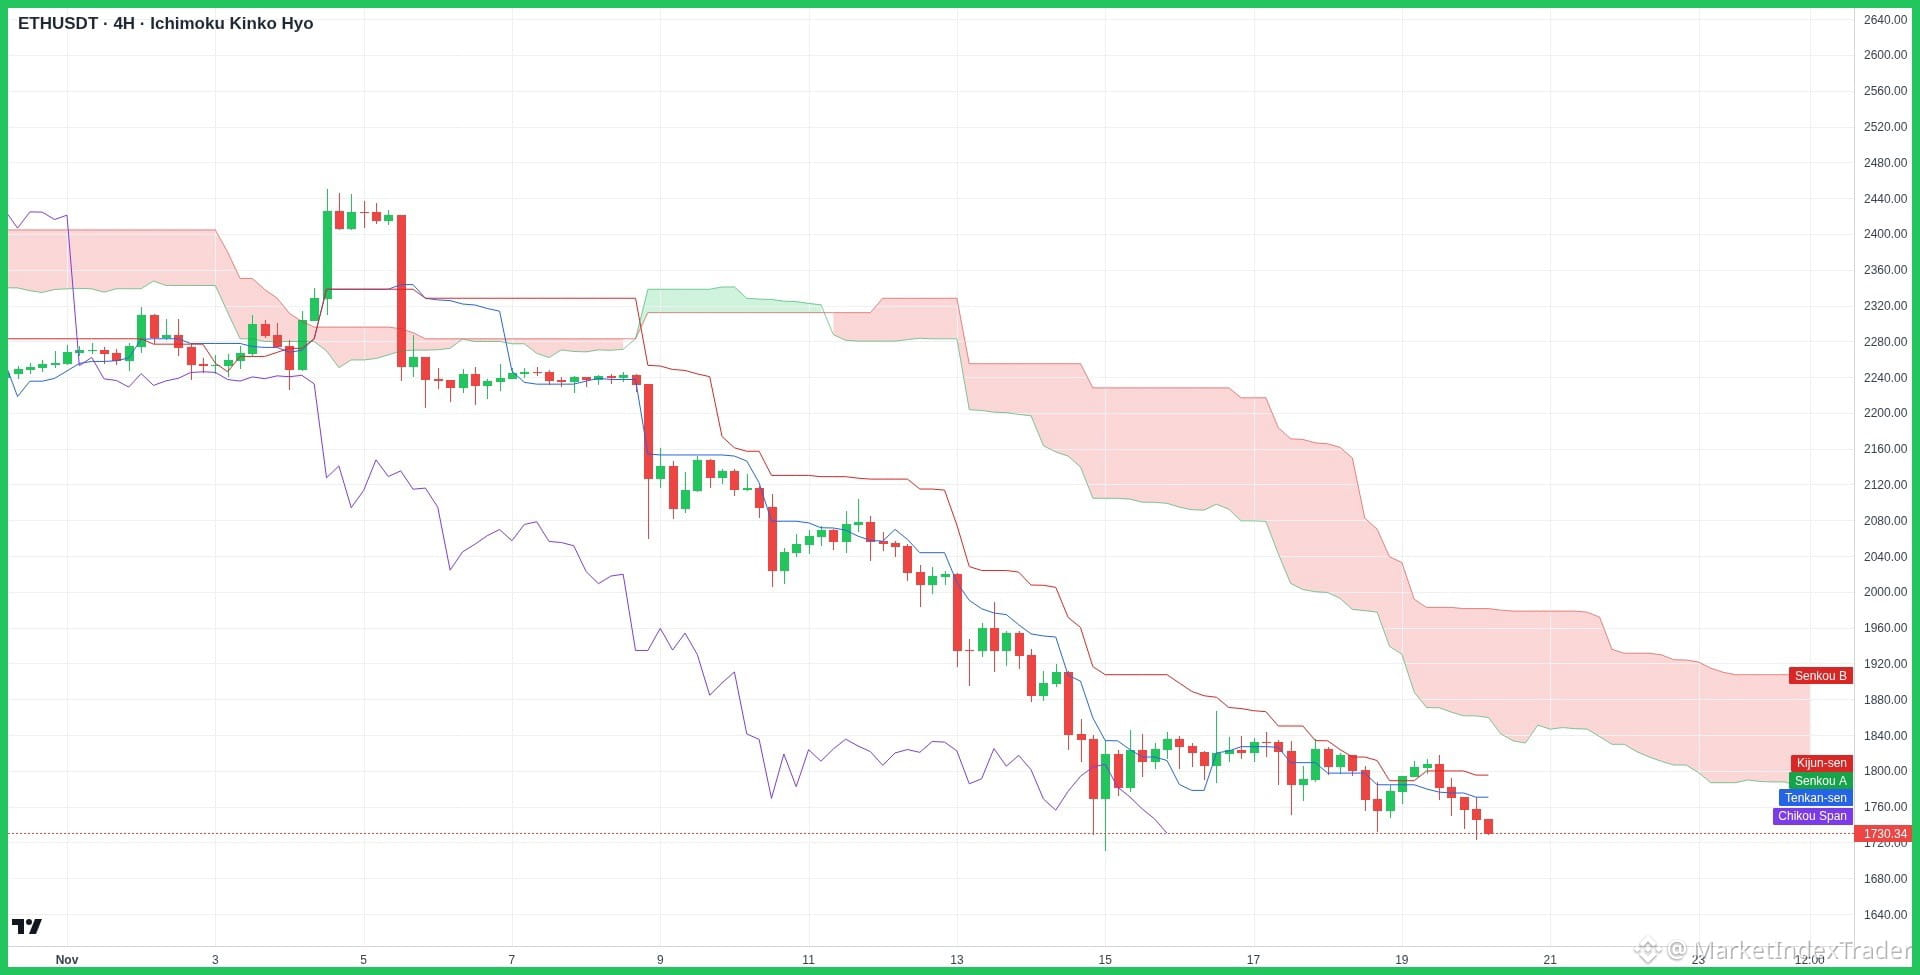
Looking at the 4H timeframe with Ichimoku Kinko Hyo, $ETH is currently testing a key local support level around $1,730. Price action is trading below the red Kumo Cloud, indicating a short-term bearish trend. Immediate overhead resistance is stacked around $1,800 - $1,840 (Kijun-sen zone), while major cloud resistance sits at $1,910. A reclaim of $1,840 could trigger a reversal toward $1,900+, whereas a drop below $1,720 might push price to retest lower liquidity around $1,680.
Fundamental Analysis
On the fundamental side, Ethereum continues to display massive ecosystem resilience driven by surging Layer-2 TVL and strong institutional demand for staking yield. With upcoming network enhancements aimed at boosting scalability and lowering execution fees, the long-term outlook for ETH remains exceptionally strong despite short-term market volatility.
Action Plan
My strategy here is patient accumulation around the $1,700–$1,730 support band. I'm watching for a strong 4H bullish reversal pattern or a crossover above Tenkan-sen before scaling into a larger position.
Highly recommend HOLD and Stacking $ETH at Binance
Feel free to comment the altcoin you are holding and we will check it for you!
ETH #TechnicalAnalysis #Crypto #BinanceSquare #Ethereum
$ETH's 4H chart is testing a critical support zone around $1,730 while under heavy Ichimoku Cloud resistance.
Alright team, let's break down this juicy $ETH chart and see what's cooking!
Technical Analysis
Looking at the 4H timeframe with Ichimoku Kinko Hyo, $ETH is currently testing a key local support level around $1,730. Price action is trading below the red Kumo Cloud, indicating a short-term bearish trend. Immediate overhead resistance is stacked around $1,800 - $1,840 (Kijun-sen zone), while major cloud resistance sits at $1,910. A reclaim of $1,840 could trigger a reversal toward $1,900+, whereas a drop below $1,720 might push price to retest lower liquidity around $1,680.
Fundamental Analysis
On the fundamental side, Ethereum continues to display massive ecosystem resilience driven by surging Layer-2 TVL and strong institutional demand for staking yield. With upcoming network enhancements aimed at boosting scalability and lowering execution fees, the long-term outlook for ETH remains exceptionally strong despite short-term market volatility.
Action Plan
My strategy here is patient accumulation around the $1,700–$1,730 support band. I'm watching for a strong 4H bullish reversal pattern or a crossover above Tenkan-sen before scaling into a larger position.
Highly recommend HOLD and Stacking $ETH at Binance
Feel free to comment the altcoin you are holding and we will check it for you!
ETH #TechnicalAnalysis #Crypto #BinanceSquare #Ethereum