

Crypto exchange data offers a valuable window into market activity. From Bitcoin leaving exchanges to rising futures open interest, these metrics can reveal changes in trader behavior, liquidity conditions and market positioning.
But there is a problem: the same data can tell very different stories depending on how it is interpreted.
A large exchange outflow does not automatically mean investors are accumulating. Rising open interest does not necessarily indicate a bullish market. And high trading volume does not always mean an exchange has deep liquidity.
Let's break down what these indicators actually tell us, what they cannot prove, and how to use them together.
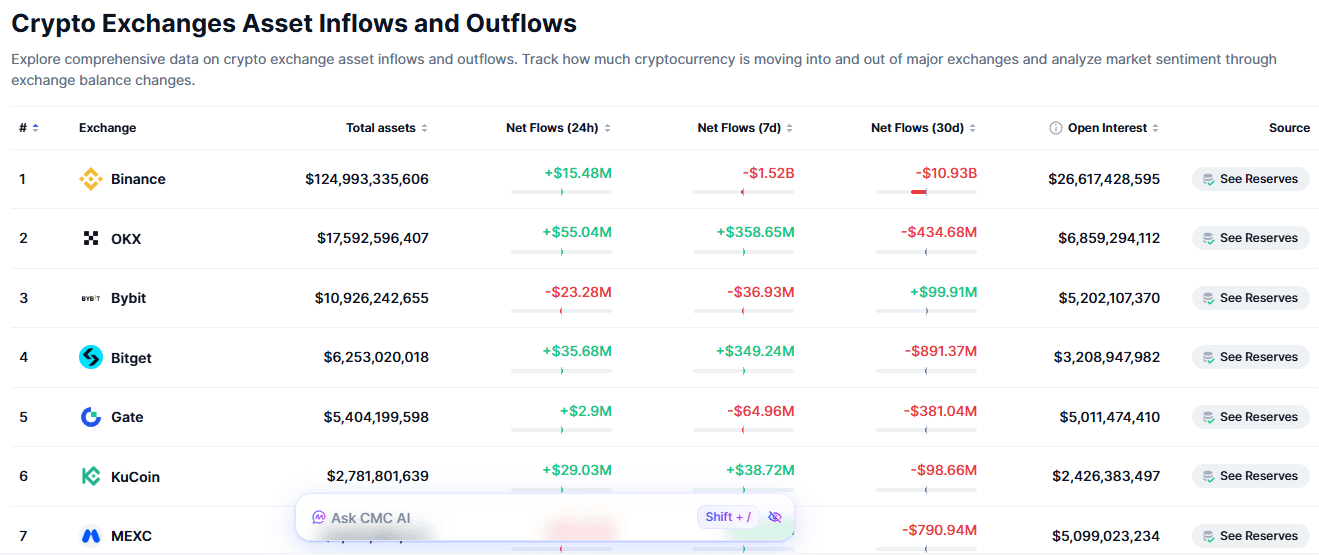
1. Exchange Netflows: Are Investors Moving Their Coins?
Exchange netflow measures the difference between assets entering and leaving an exchange.
Net inflows: More assets are deposited into exchanges than withdrawn.
Net outflows: More assets leave exchanges than enter.
For example, when Bitcoin experiences significant net outflows, some analysts interpret this as investors moving assets into self-custody for long-term holding.
However, there are other explanations.
Coins may be transferred to another exchange, moved between internal wallets, or shifted for operational reasons. Similarly, inflows do not automatically mean investors are preparing to sell.
What it tells us: Changes in asset movement and potential shifts in exchange supply.
What it cannot tell us: The exact intentions of wallet owners or whether the market is about to move up or down.
The important question is not simply how much crypto leaves an exchange, but where it goes and what happens afterward.
2. Futures Volume: Measuring Trading Activity
Futures trading volume measures the total value of contracts traded during a specific period.
A sudden increase can indicate stronger market participation, increased speculation or a reaction to major news.
However, high futures volume alone does not reveal market direction.
Both buyers and sellers participate in every matched trade. A surge in volume can occur during a strong rally, a sharp sell-off or a period of intense volatility.
It is also important to distinguish between spot volume and futures volume.
Spot volume: Measures actual trading of the underlying asset.
Futures volume: Measures trading activity in derivative contracts.
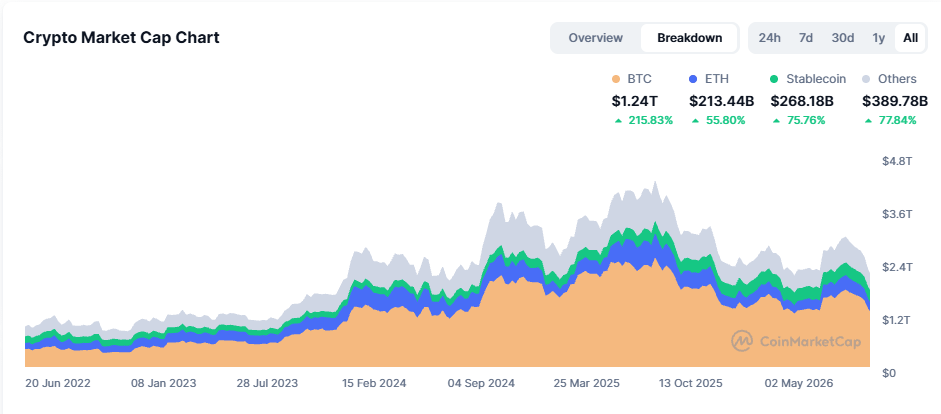
A market dominated by leveraged futures activity may behave differently from one supported by strong spot demand.
3. Open Interest: Understanding Market Positioning
Open interest (OI) represents the total number or value of outstanding derivative contracts that have not yet been closed or settled.
Unlike trading volume, which measures activity over a period, open interest measures outstanding positions at a particular moment.
Here are four common scenarios:
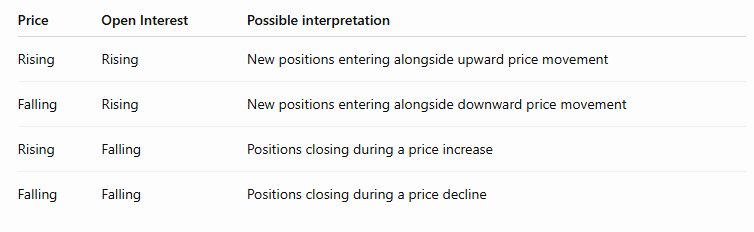
These are useful clues, not definitive explanations.
For example, rising prices and increasing open interest may suggest expanding participation in a bullish move. But it does not prove that new positions are exclusively long.
Open interest represents both sides of outstanding contracts. Funding rates, liquidation data and market structure can provide additional context.
4. Exchange Reserves: How Much Crypto Is Held on Exchanges?
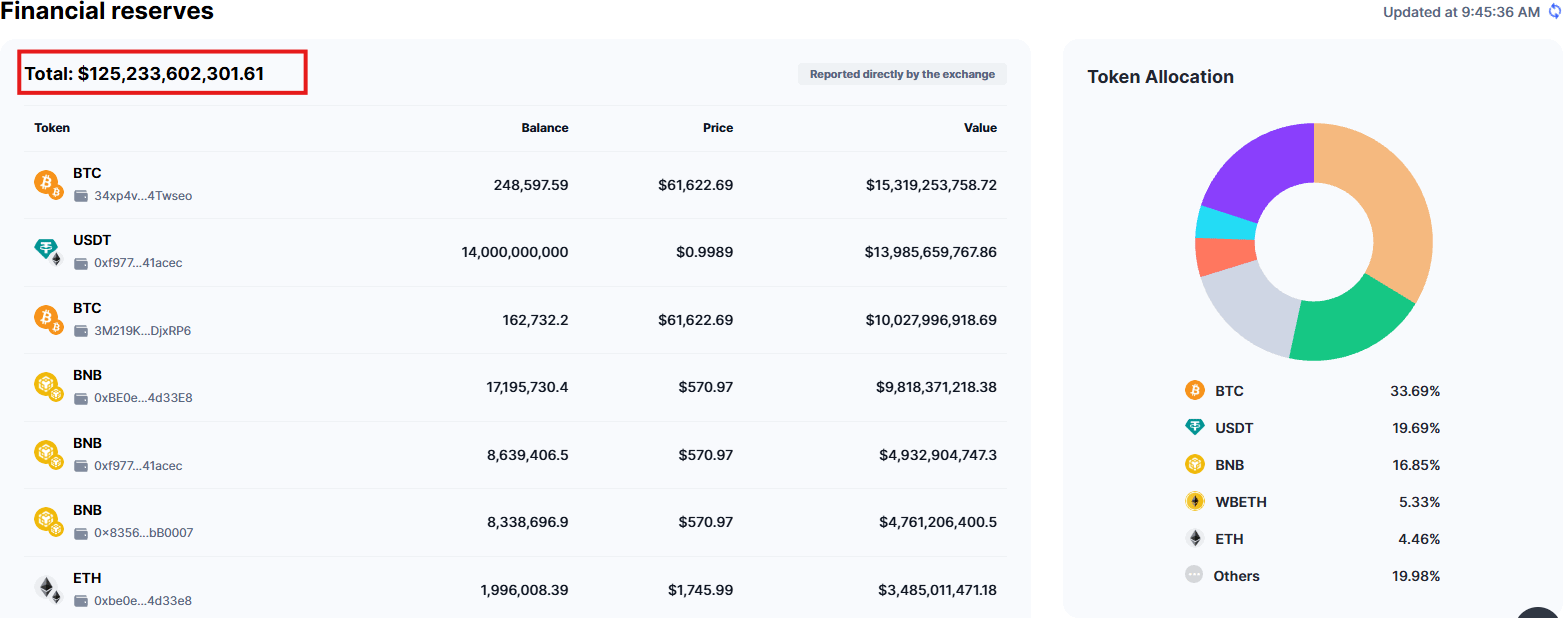
Exchange reserves estimate the amount of cryptocurrency held in wallets attributed to centralized exchanges.
Analysts monitor reserve levels to understand how much supply is potentially available within exchange-controlled wallets.
For example:
Declining reserves may indicate withdrawals or changes in custody.
Increasing reserves may indicate deposits or asset transfers into exchange wallets.
Stable reserves may suggest relatively unchanged reported holdings.
But exchange reserves have limitations.
Wallet labeling is not always complete. Exchanges may reorganize wallets, use multiple custody providers or move assets between cold and hot storage.
A declining reserve balance does not automatically mean selling pressure will disappear. Likewise, increasing reserves do not guarantee an upcoming sell-off.
Reserve data should be treated as an estimate, not a complete picture of all available market supply.
5. Liquidity: Why Trading Volume Is Not Enough
Liquidity describes how easily an asset can be bought or sold without significantly affecting its price.
This is one of the most important metrics for understanding exchange quality and market conditions.
Several indicators help measure liquidity:
Bid-ask spread: The difference between the highest buying price and lowest selling price.
Order book depth: The amount of buy and sell orders available at different price levels.
Slippage: The difference between the expected execution price and the actual execution price.
Market depth: How much trading activity the market can absorb before prices move significantly.
An exchange may report billions of dollars in daily trading volume but still have limited order book depth for a particular trading pair.
This is why professional traders often examine liquidity around the current market price rather than relying entirely on reported volume.
6. Comparing Exchanges: Avoid These Common Mistakes
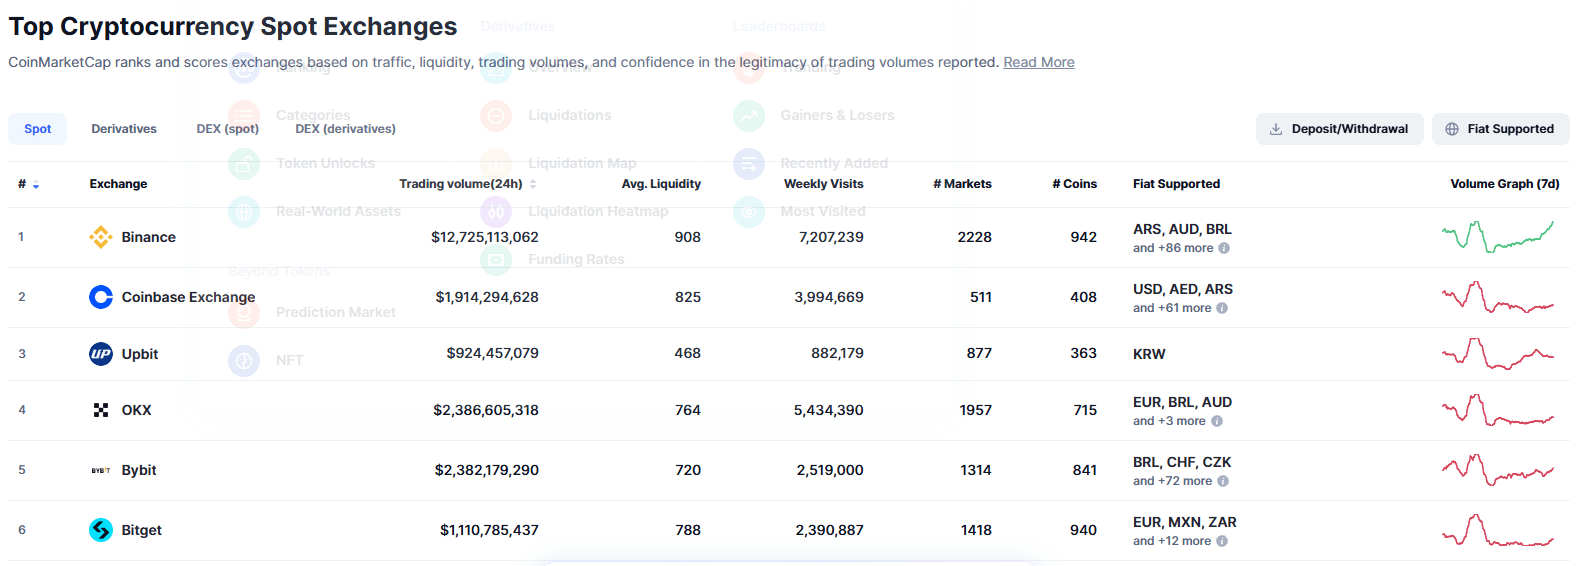
Not all exchange data is directly comparable.
Different platforms may calculate and report metrics using different methodologies.
Some common comparison mistakes include:
Mixing spot and futures volume: These represent different types of market activity.
Ignoring reporting periods: Comparing 24-hour data with weekly or monthly figures creates misleading conclusions.
Ignoring asset coverage: One platform may report reserves for more assets than another.
Overlooking internal transfers: Wallet movements can distort interpretations of exchange netflows.
Ignoring liquidity differences: High volume does not necessarily mean better execution.
Comparing different contract types: Open interest in USD-margined and coin-margined contracts may require different treatment.
For meaningful comparisons, analysts should use consistent timeframes, asset coverage, contract types and measurement methods.
7. How to Combine These Metrics for Better Market Analysis
The real value comes from combining indicators rather than looking at one metric in isolation.
Consider a hypothetical Bitcoin market scenario:
Exchange reserves are declining.
Net outflows are increasing.
Spot trading volume is rising.
Futures open interest is increasing.
Funding rates are becoming increasingly positive.
This could suggest stronger market participation, increased withdrawals and growing leveraged long positioning.
But there is another possibility: excessive leverage is building, making the market vulnerable to a long liquidation event.
Now imagine open interest declining while spot volume increases. This may indicate that leveraged positions are being reduced while spot trading remains active.
Neither scenario guarantees a particular price direction.
The objective is to identify market conditions, understand potential risks and avoid making decisions based on isolated numbers.
Conclusion: Data Is a Tool, Not a Crystal Ball
Exchange data has become an essential part of modern crypto market analysis. Netflows, futures volume, open interest, reserves and liquidity can help investors understand how capital moves and how market participants position themselves.
However, every metric has limitations.
A large outflow is not automatically bullish. High open interest is not automatically bearish. And billions in trading volume do not guarantee deep liquidity.
The strongest analysis comes from combining multiple indicators, checking their underlying methodology and comparing them across consistent timeframes.
Don't just watch where the money moves. Understand why the data may be moving, what it actually measures, and what it cannot prove.
Disclaimer: This article is for educational and informational purposes only. It does not constitute financial or investment advice.
#crypto #blockchain #Web3 #Aİ #education