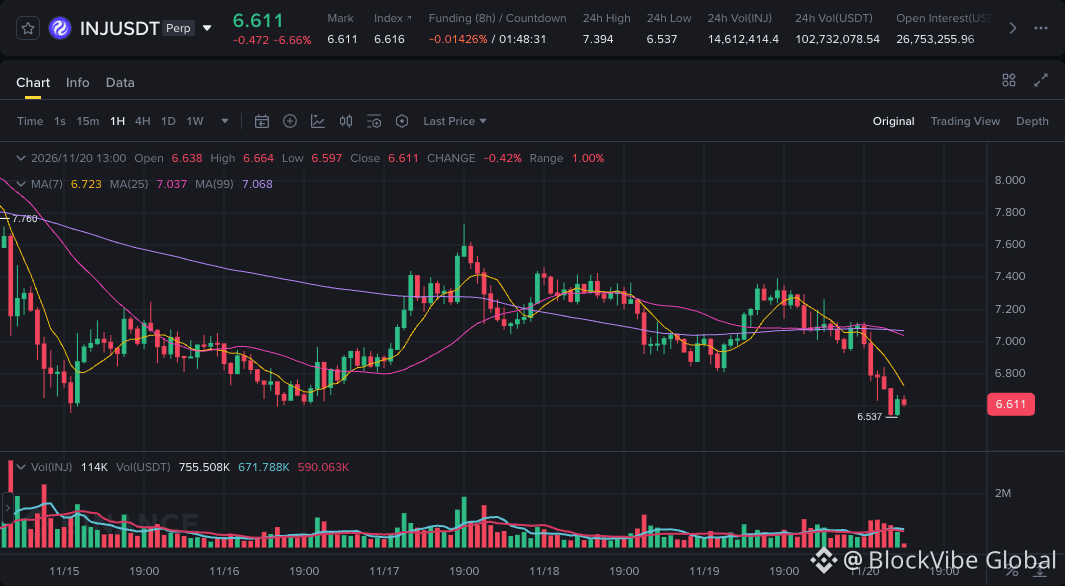

INJ breaks its 24-hour floor while the bounce band sits overhead
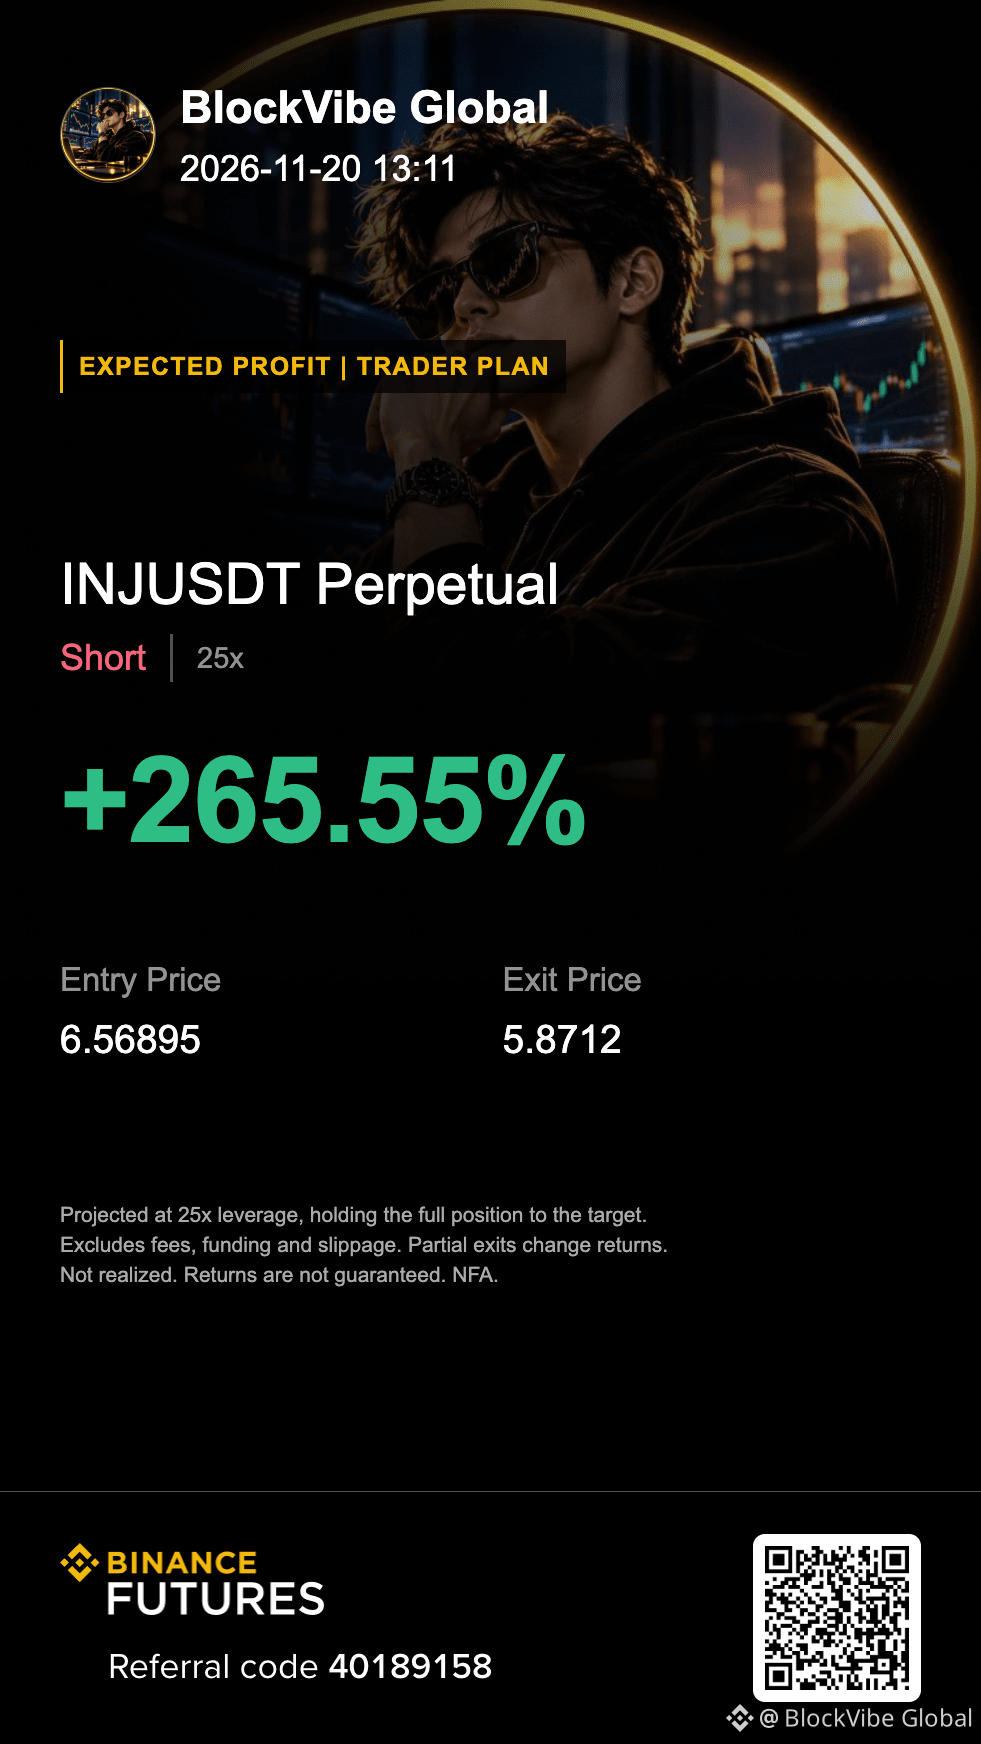
🔴 $INJ - SHORT
Trade Plan:
Entry Zone: 6.4901 – 6.6478
SL: 6.9124
TP1: 6.2845 | TP2: 6.1021 | TP3: 5.8712
Why this setup?
- The last two closed 4h candles were overlapping and mixed, so the break lower is not yet a clean trend leg; the 6.4901–6.6478 band sits just above the broken floor as potential supply.
- Closed-candle 15m RSI(14) at 26.1 is deep in oversold territory, which argues for a bounce into the band rather than chasing the break at the lows.
- The latest 15m volume was only 0.61x the twenty-candle mean, so the break lacks strong tape confirmation and a lift into the band is the cleaner test.
Funding at -0.0112% is slightly negative while open interest rose 2.27% hourly; that combination is consistent with new short exposure building, though OI alone can't confirm direction.
Risk: A decisive 4h close back above 6.6478 with expanding volume would invalidate the breakdown and squeeze shorts.
Does the thin 15m tape mean the break is running out of sellers?
DYOR & manage risk!
$INJ
🔴 $INJ - SHORT
Trade Plan:
Entry Zone: 6.4901 – 6.6478
SL: 6.9124
TP1: 6.2845 | TP2: 6.1021 | TP3: 5.8712
Why this setup?
- The last two closed 4h candles were overlapping and mixed, so the break lower is not yet a clean trend leg; the 6.4901–6.6478 band sits just above the broken floor as potential supply.
- Closed-candle 15m RSI(14) at 26.1 is deep in oversold territory, which argues for a bounce into the band rather than chasing the break at the lows.
- The latest 15m volume was only 0.61x the twenty-candle mean, so the break lacks strong tape confirmation and a lift into the band is the cleaner test.
Funding at -0.0112% is slightly negative while open interest rose 2.27% hourly; that combination is consistent with new short exposure building, though OI alone can't confirm direction.
Risk: A decisive 4h close back above 6.6478 with expanding volume would invalidate the breakdown and squeeze shorts.
Does the thin 15m tape mean the break is running out of sellers?
DYOR & manage risk!
$INJ