


/USDT: Is a Long-Term Recovery Possible? 📈
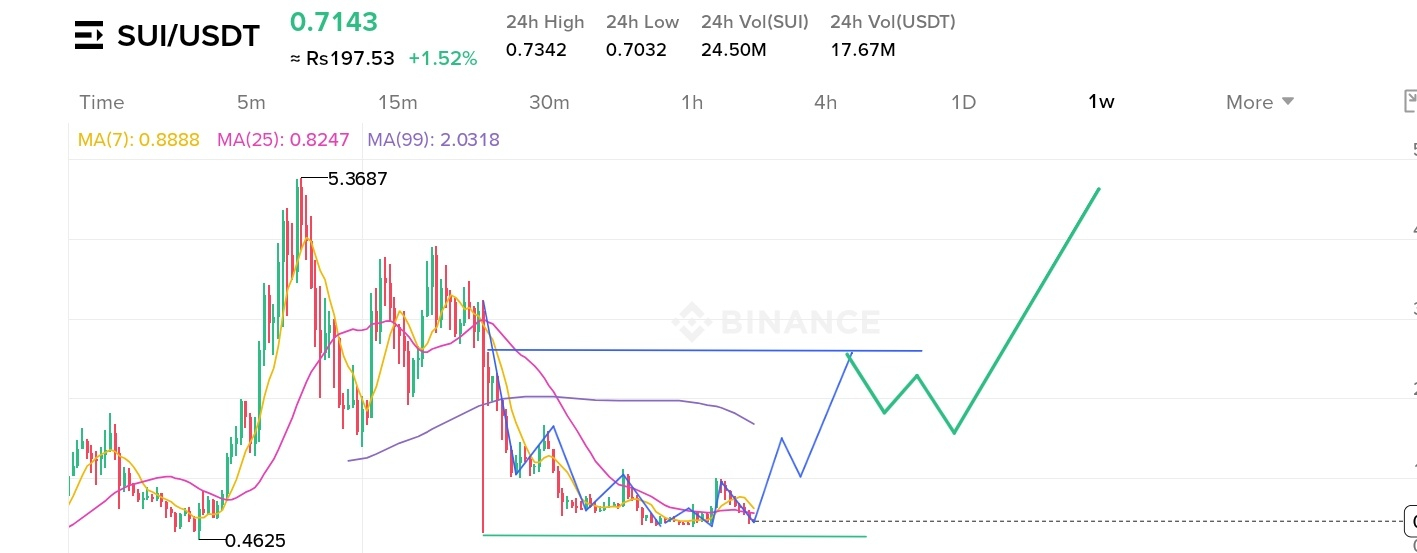
SUI is currently trading around $0.7143 on the weekly chart.
After reaching a previous high of $5.3687, the price experienced a significant decline and later formed a low near $0.4625.
Now, an important question is: Could SUI be preparing for a long-term recovery?
My chart observations
- Support area: Around $0.46
- Current price: Around $0.71
- MA(7): $0.8888
- MA(25): $0.8247
- MA(99): $2.0318
The price is currently below all three moving averages, which means the long-term trend still needs confirmation.
My possible scenario
I am watching for a recovery, followed by a possible pullback and another upward move.
However, SUI first needs to show strength, reclaim important resistance levels, and confirm a breakout with weekly candle closes and volume.
The move toward $2.7 or even higher is only a long-term possibility in my drawing, not a guaranteed target.
My trading mindset
I believe patience is important in trading. Instead of chasing every green candle, I prefer to wait for confirmation and respect support and resistance.
What do you think? Is SUI building a long-term base, or could it fall further before recovering?
Share your analysis below. 👇