WHAT REALLY HAPPENED? AND WHAT COULD COME NEXT?
If you noticed an unusually LONG WICK or sudden volatility on the $BITO chart, don't immediately consider it a normal pump or dump.
This movement is related to the 1-for-2 REVERSE STOCK SPLIT and contract adjustment. In a reverse split, every 2 shares are combined into 1 share, with the price adjusted accordingly. During split adjustments, market reopening and contract transitions, charts can sometimes display unusual vertical movements.
But there's another interesting thing on the chart!
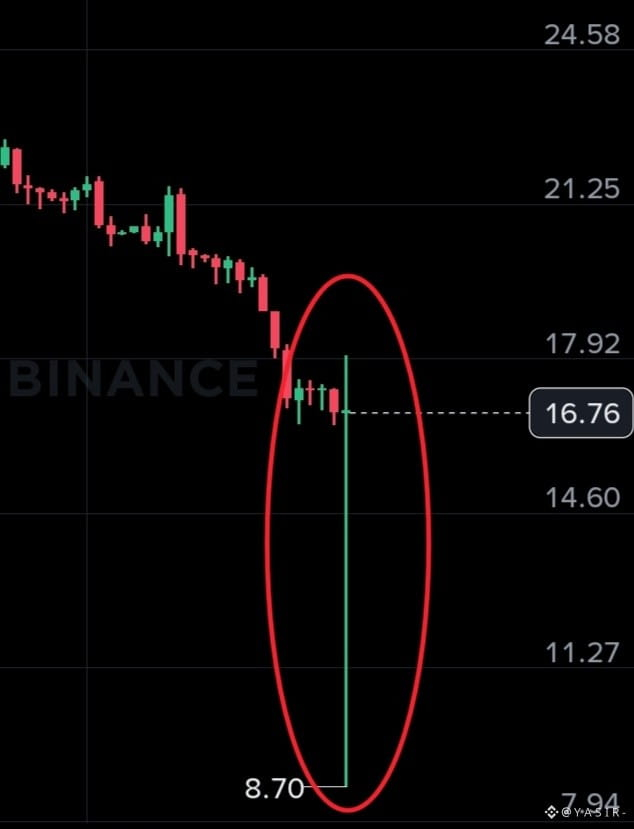
Price has shown a HUGE LOWER WICK, reaching around $8.70 before recovering towards the $16.85 area. This shows a strong rejection of lower prices on the displayed chart, and buyers may be stepping in around those levels.
I'm keeping an eye on the possibility of an upward move from here. That lower wick is definitely an important area to watch, although we still need confirmation from price action and volume.
Will $BITO turn this unusual volatility into a recovery move? Let's watch what happens next.
If you noticed an unusually LONG WICK or sudden volatility on the $BITO chart, don't immediately consider it a normal pump or dump.
This movement is related to the 1-for-2 REVERSE STOCK SPLIT and contract adjustment. In a reverse split, every 2 shares are combined into 1 share, with the price adjusted accordingly. During split adjustments, market reopening and contract transitions, charts can sometimes display unusual vertical movements.
But there's another interesting thing on the chart!
Price has shown a HUGE LOWER WICK, reaching around $8.70 before recovering towards the $16.85 area. This shows a strong rejection of lower prices on the displayed chart, and buyers may be stepping in around those levels.
I'm keeping an eye on the possibility of an upward move from here. That lower wick is definitely an important area to watch, although we still need confirmation from price action and volume.
Will $BITO turn this unusual volatility into a recovery move? Let's watch what happens next.