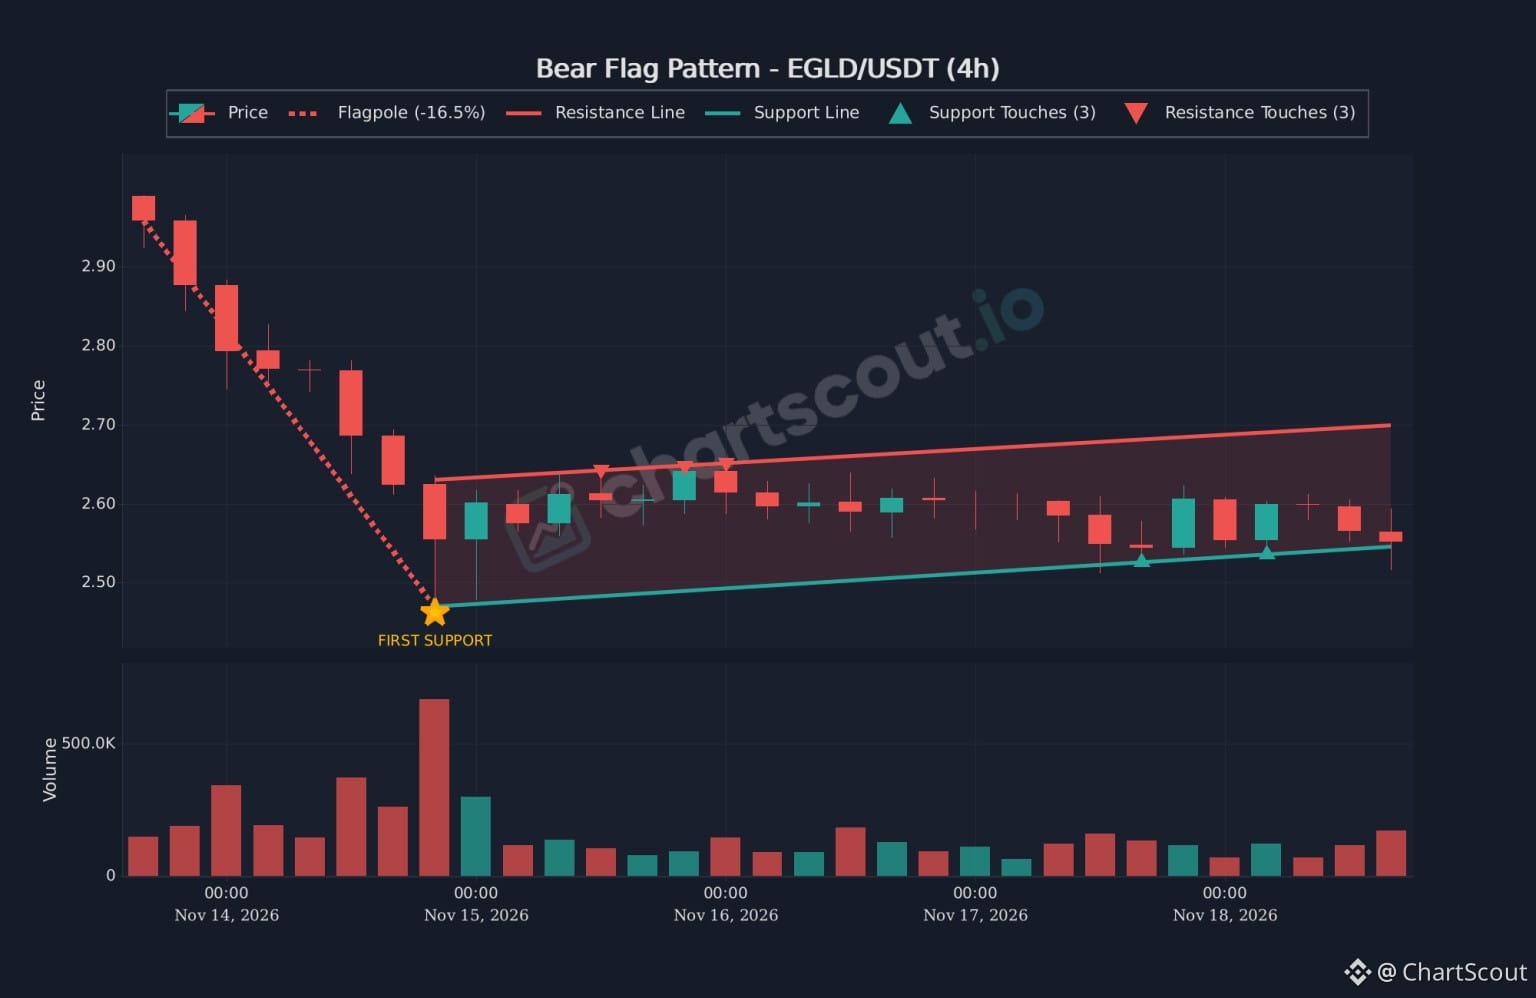
EGLD/USDT 4h: before and after the drop 🔍
Before: 2.99, with price falling hard.
After: a −16.5% flagpole, then 4–5 days of slow drift in a rising channel with 3 touches on each line.
Price is now at the lower line near 2.55. Volume was around 650K at the peak of the drop and has stayed far lower.
A bear flag only matters on a 4h close below the lower line. Until then it's a pattern to watch, not a signal.
Chart from ChartScout (free trial in our profile).
#EGLD #TechnicalAnalysis #EGLDUSDT #ChartScout
Before: 2.99, with price falling hard.
After: a −16.5% flagpole, then 4–5 days of slow drift in a rising channel with 3 touches on each line.
Price is now at the lower line near 2.55. Volume was around 650K at the peak of the drop and has stayed far lower.
A bear flag only matters on a 4h close below the lower line. Until then it's a pattern to watch, not a signal.
Chart from ChartScout (free trial in our profile).
#EGLD #TechnicalAnalysis #EGLDUSDT #ChartScout