
🔍 $PIPPIN : IS AN "M" PATTERN FORMING ON THE 5M CHART?
Short answer: it may be, but it is not confirmed yet.
📊 WHAT THE CHART SHOWS
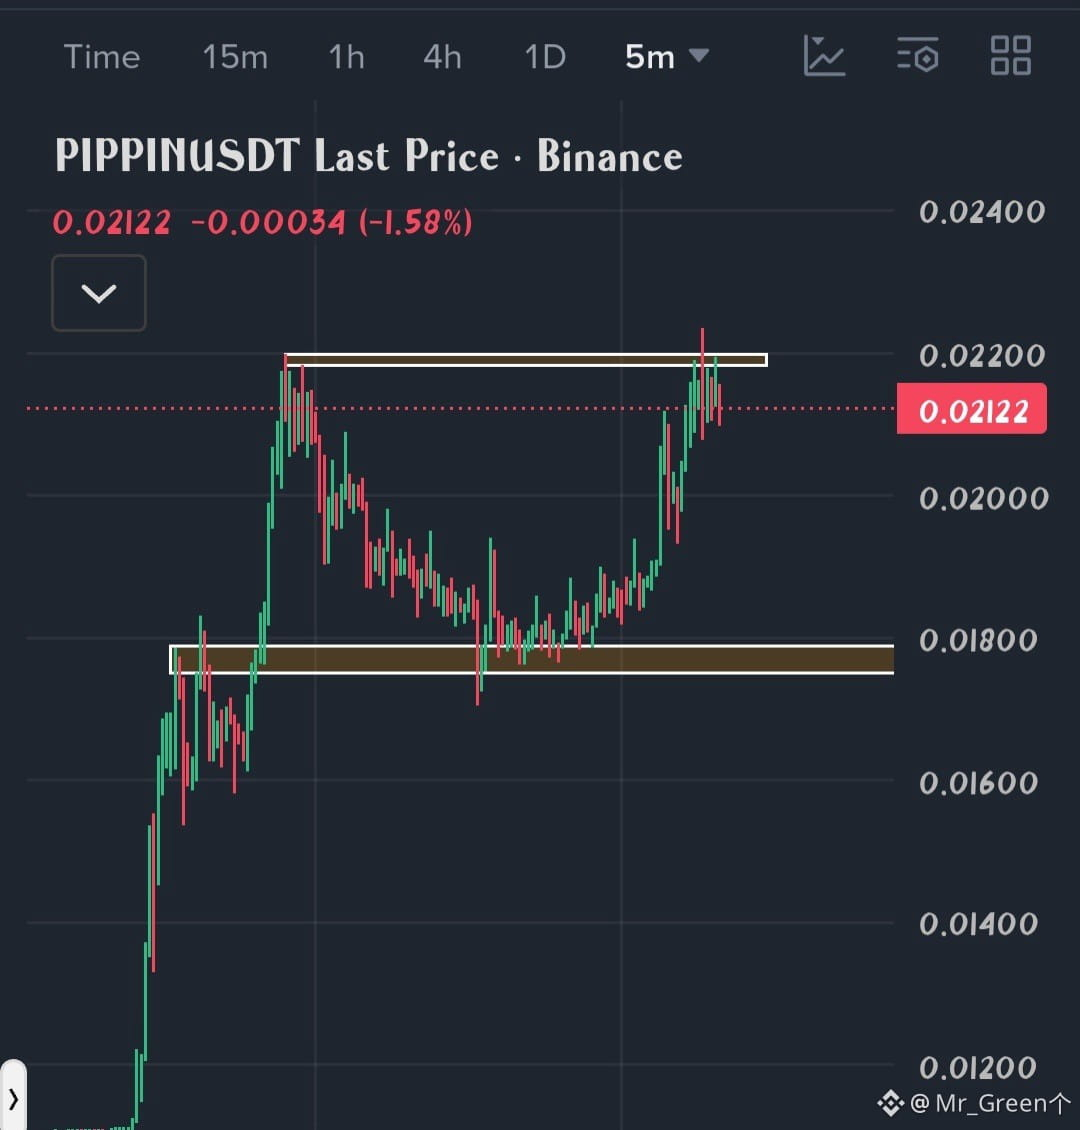
PIPPIN rallied to the $0.0220 area, pulled back to the $0.0178–$0.0185 range, then climbed back and tapped $0.0220 again. The second push wicked up to about $0.02235 and was rejected, and price is now at $0.02122. Two peaks at the same level with a dip between them is the classic double top, or "M" pattern.
🧩 WHAT SUPPORTS THE M PATTERN
Both tops stalled at the same $0.0220 resistance
The second top printed a wick above the first and was rejected straight away, which looks like a liquidity sweep
Price is now slipping back from the highs
🛑 WHAT KEEPS IT UNCONFIRMED
An M pattern is only valid after the neckline breaks. Here the neckline is the $0.0176–$0.0180 support zone, and price is still well above it
The move between the tops is a smooth, rounded recovery, not a sharp drop, which is also how a cup-and-handle looks
The 5m timeframe produces many false patterns, so confirmation matters more
🎯 KEY LEVELS
Bearish scenario (M confirms):
Trigger: a 5m close below $0.0176
Measured move target: about $0.0135 (pattern height of about $0.0043 projected down from the neckline)
Bullish scenario (pattern fails):
Trigger: a strong 5m close above $0.0224
Next area: $0.0235–$0.0240
MY TAKE:
This looks like a double top in the making, but I don't treat it as one until the neckline breaks. Until then, price is just ranging between $0.0178 and $0.0220. The breakout side will decide the next big move, so I'm waiting for a close beyond either level.
A double top needs a neckline break. Without it, it is just two highs.
Do you see an M pattern here, or a breakout coming? What is your level?
Follow for more chart analysis and trading opportunities.
This is analysis only, not a trade signal or financial advice. Always do your own research.
#PIPPIN #Crypto #TechnicalAnalysis
$MMT
$AIOT
Short answer: it may be, but it is not confirmed yet.
📊 WHAT THE CHART SHOWS
PIPPIN rallied to the $0.0220 area, pulled back to the $0.0178–$0.0185 range, then climbed back and tapped $0.0220 again. The second push wicked up to about $0.02235 and was rejected, and price is now at $0.02122. Two peaks at the same level with a dip between them is the classic double top, or "M" pattern.
🧩 WHAT SUPPORTS THE M PATTERN
Both tops stalled at the same $0.0220 resistance
The second top printed a wick above the first and was rejected straight away, which looks like a liquidity sweep
Price is now slipping back from the highs
🛑 WHAT KEEPS IT UNCONFIRMED
An M pattern is only valid after the neckline breaks. Here the neckline is the $0.0176–$0.0180 support zone, and price is still well above it
The move between the tops is a smooth, rounded recovery, not a sharp drop, which is also how a cup-and-handle looks
The 5m timeframe produces many false patterns, so confirmation matters more
🎯 KEY LEVELS
Bearish scenario (M confirms):
Trigger: a 5m close below $0.0176
Measured move target: about $0.0135 (pattern height of about $0.0043 projected down from the neckline)
Bullish scenario (pattern fails):
Trigger: a strong 5m close above $0.0224
Next area: $0.0235–$0.0240
MY TAKE:
This looks like a double top in the making, but I don't treat it as one until the neckline breaks. Until then, price is just ranging between $0.0178 and $0.0220. The breakout side will decide the next big move, so I'm waiting for a close beyond either level.
A double top needs a neckline break. Without it, it is just two highs.
Do you see an M pattern here, or a breakout coming? What is your level?
Follow for more chart analysis and trading opportunities.
This is analysis only, not a trade signal or financial advice. Always do your own research.
#PIPPIN #Crypto #TechnicalAnalysis
$MMT
$AIOT