Know that feeling when price just hangs right above the floor and everyone holds their breath?
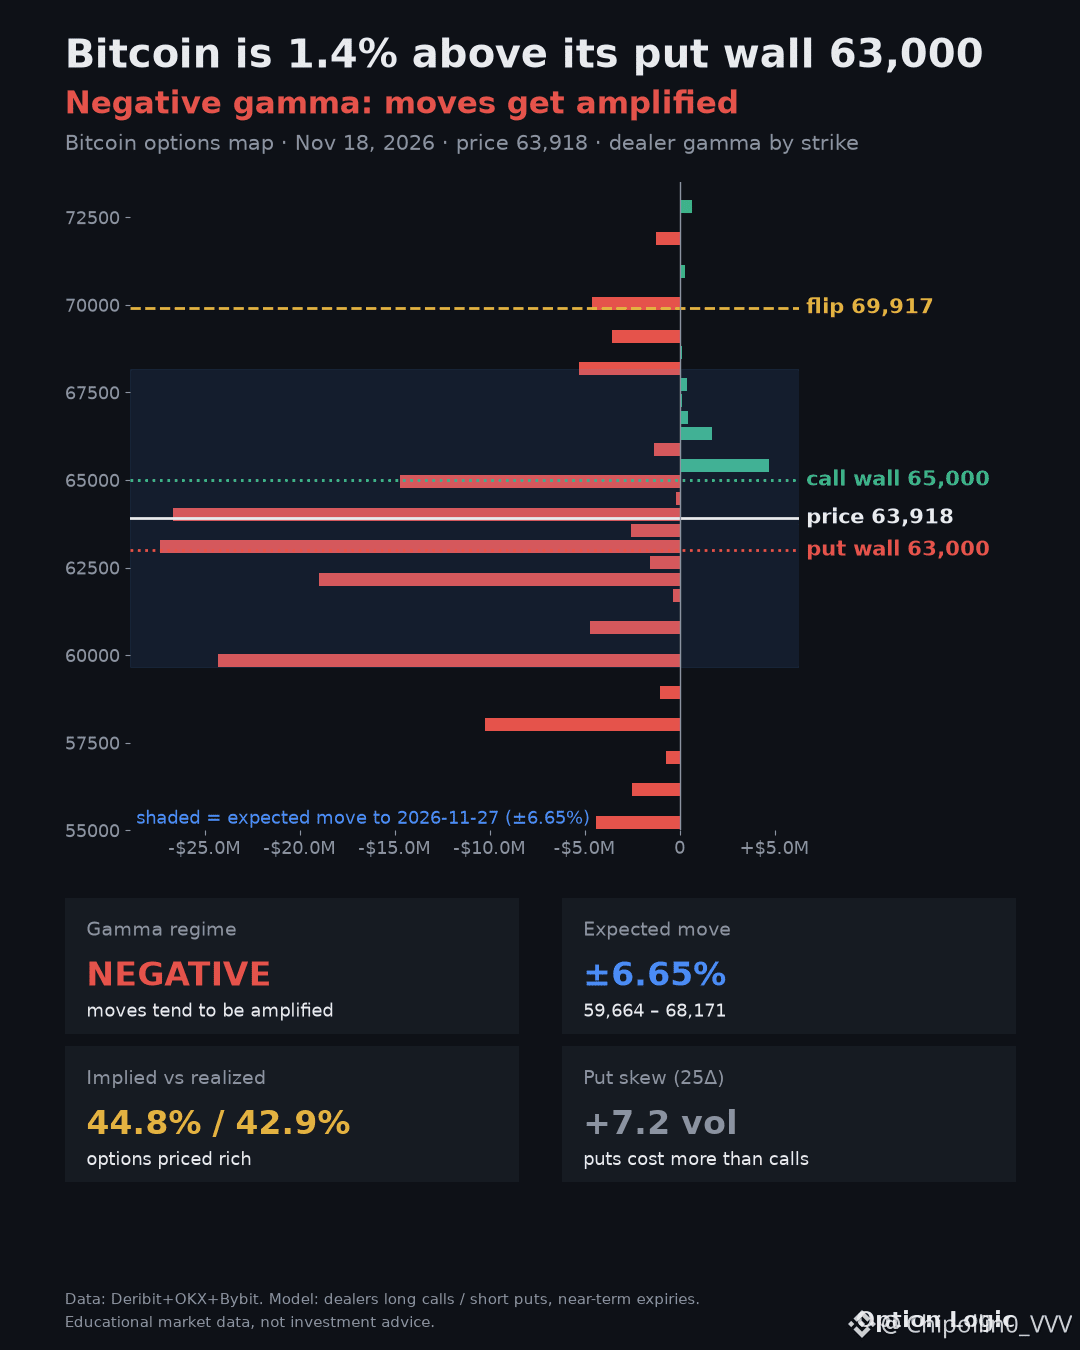
Looking at the options map for $BTC, I think we are in a very twitchy spot with negative gamma. Price is at 63,343, sitting just 0.5% above the put wall at 63,000 which acts as our main support below. The call wall sits way up at 65,000, and the gamma flip point is way higher at 69,917 with an expected move of ±6.65%. The way the market looks, my guess is if 63,000 holds, longs can breathe and eye that 65,000 ceiling, but break that floor and the shorts get paid while the crowd gets squeezed out.
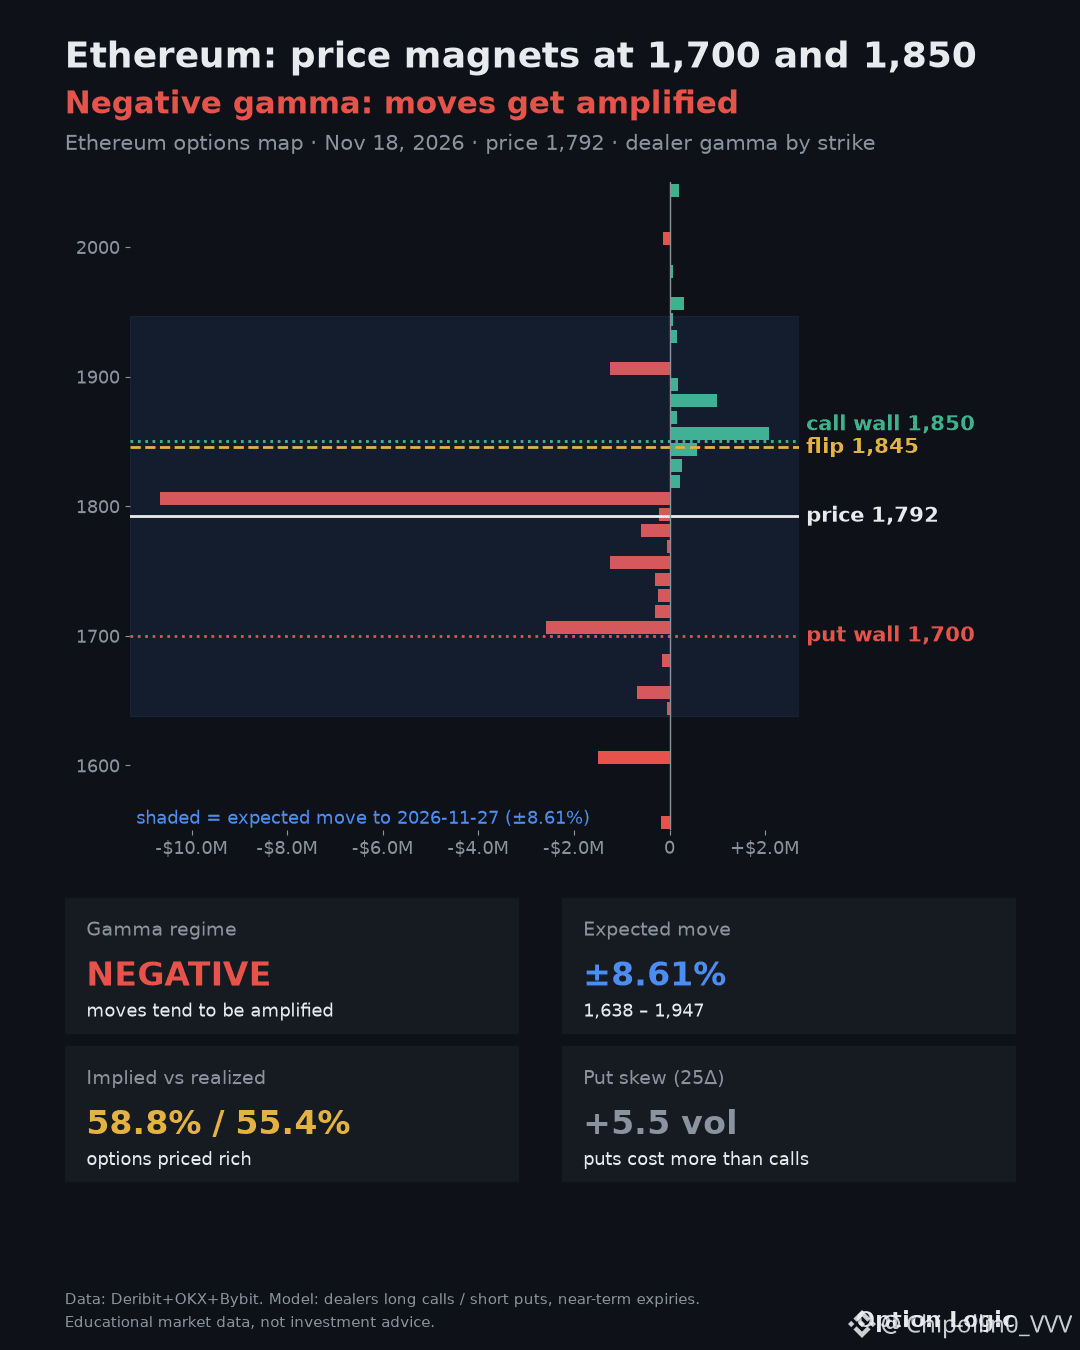
Over on $ETH, it's a similar nerve-wracking dance with negative gamma at 1,764. We have the put wall down at 1,700 and the call wall at 1,850, while the gamma flip sits right near it at 1,845 with an expected move of ±8.61%. I'd watch how it reacts around these bounds because things get really hot here.
Which side are you on in this mess, and what level are you watching closest? #BTC #ETH
Looking at the options map for $BTC, I think we are in a very twitchy spot with negative gamma. Price is at 63,343, sitting just 0.5% above the put wall at 63,000 which acts as our main support below. The call wall sits way up at 65,000, and the gamma flip point is way higher at 69,917 with an expected move of ±6.65%. The way the market looks, my guess is if 63,000 holds, longs can breathe and eye that 65,000 ceiling, but break that floor and the shorts get paid while the crowd gets squeezed out.
Over on $ETH, it's a similar nerve-wracking dance with negative gamma at 1,764. We have the put wall down at 1,700 and the call wall at 1,850, while the gamma flip sits right near it at 1,845 with an expected move of ±8.61%. I'd watch how it reacts around these bounds because things get really hot here.
Which side are you on in this mess, and what level are you watching closest? #BTC #ETH