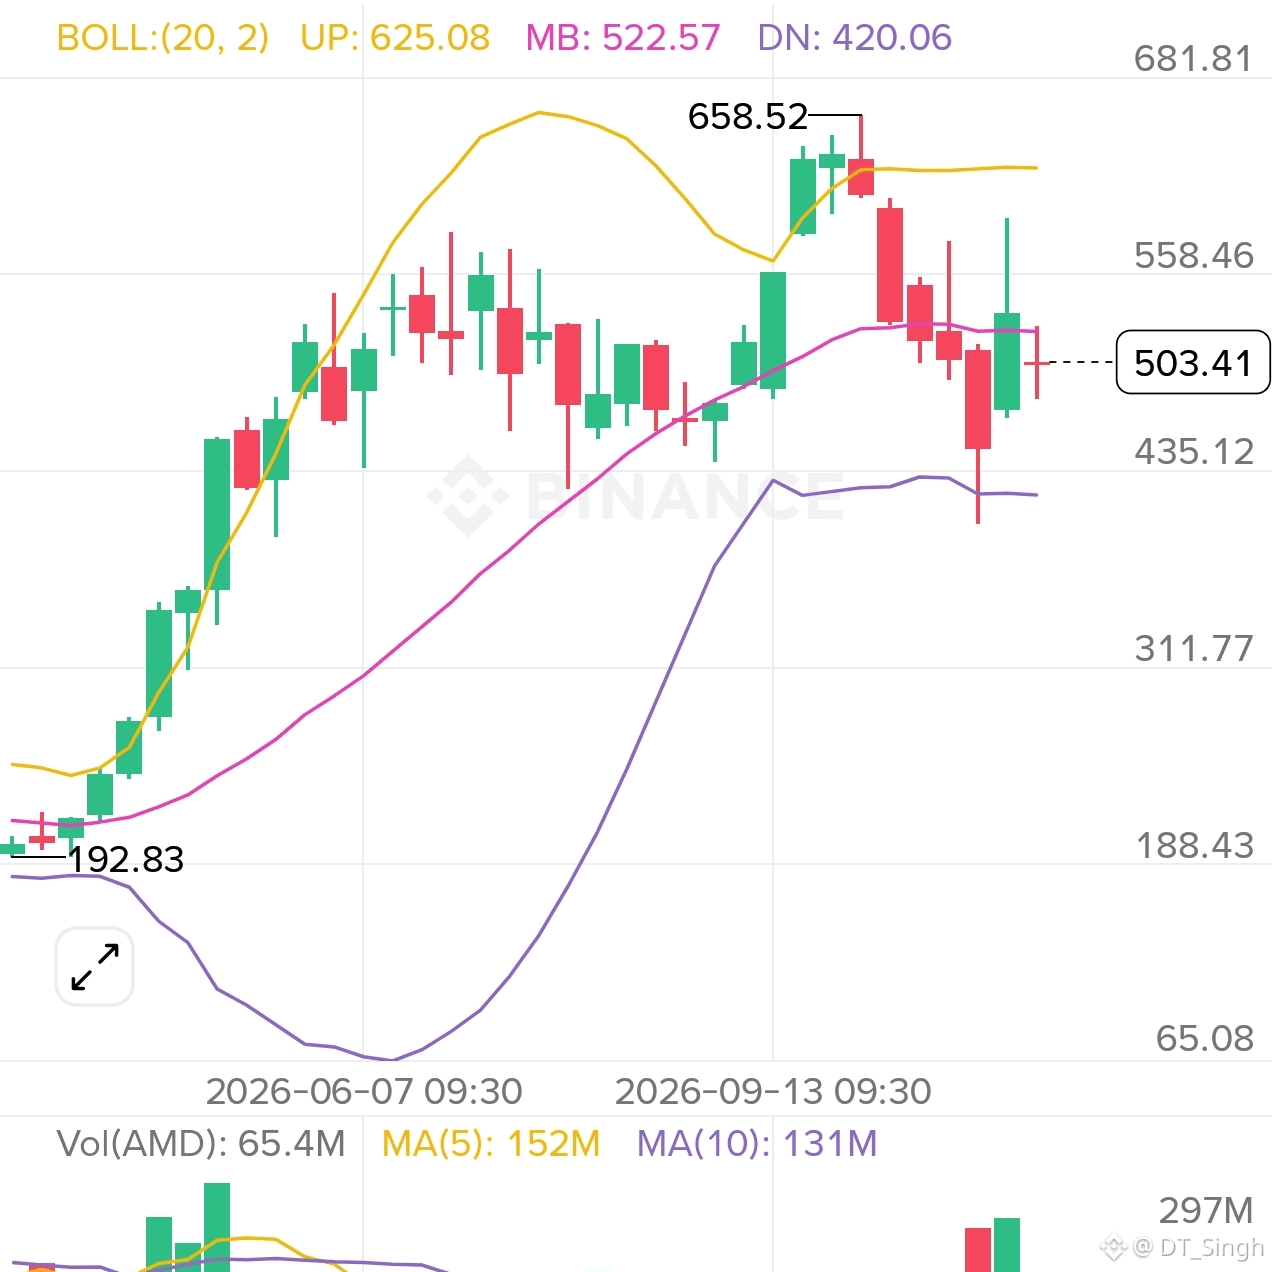

closed the last session at $503.41 and is trading at $510.68 in pre-market (+1.44%) 📊
The weekly chart shows a big run from the 192.83 low to a high of 658.52 (more than 3x). Since then price has pulled back about 24%. One recent weekly candle wicked below the lower Bollinger band and was bought back quickly, the next week pushed back above the midline, and the latest candle has slipped just under it again.
Chart levels I'm watching (weekly):
🔴 Resistance: 522.57 (BOLL midline), then about 590 and 625.08 (upper band)
🟢 Support: about 470, then 420.06 (lower band)
🟡 Key level: 658.52 (the high)
Volume spiked on both the sell-off week and the rebound week, which fits buyers stepping in near the lower band. The latest weekly bar (65.4M) is well below the 5-bar average (152M), but that week probably isn't finished yet.
On Binance, the bStocks token AMDB is quoted at 511.24. Pre-market liquidity is thin, so the open can look different.
A weekly close above 522.57 would be a first sign buyers are back, and a close above 658.52 would restore the uptrend. A weekly close below 420 would point to a deeper pullback.
Do you see $AMD as a dip inside a bigger uptrend or the start of something deeper? 👇
Chart-based observation only, not financial advice. NFA, manage your own risk.$AMD.US #CanNvidia’sDataCenterGrowthContinue? #LedgerHardwareImplantReportsExtendToDubai
The weekly chart shows a big run from the 192.83 low to a high of 658.52 (more than 3x). Since then price has pulled back about 24%. One recent weekly candle wicked below the lower Bollinger band and was bought back quickly, the next week pushed back above the midline, and the latest candle has slipped just under it again.
Chart levels I'm watching (weekly):
🔴 Resistance: 522.57 (BOLL midline), then about 590 and 625.08 (upper band)
🟢 Support: about 470, then 420.06 (lower band)
🟡 Key level: 658.52 (the high)
Volume spiked on both the sell-off week and the rebound week, which fits buyers stepping in near the lower band. The latest weekly bar (65.4M) is well below the 5-bar average (152M), but that week probably isn't finished yet.
On Binance, the bStocks token AMDB is quoted at 511.24. Pre-market liquidity is thin, so the open can look different.
A weekly close above 522.57 would be a first sign buyers are back, and a close above 658.52 would restore the uptrend. A weekly close below 420 would point to a deeper pullback.
Do you see $AMD as a dip inside a bigger uptrend or the start of something deeper? 👇
Chart-based observation only, not financial advice. NFA, manage your own risk.$AMD.US #CanNvidia’sDataCenterGrowthContinue? #LedgerHardwareImplantReportsExtendToDubai