$BTC
📊 CRYPTO MARKET UPDATE — 18 Nov
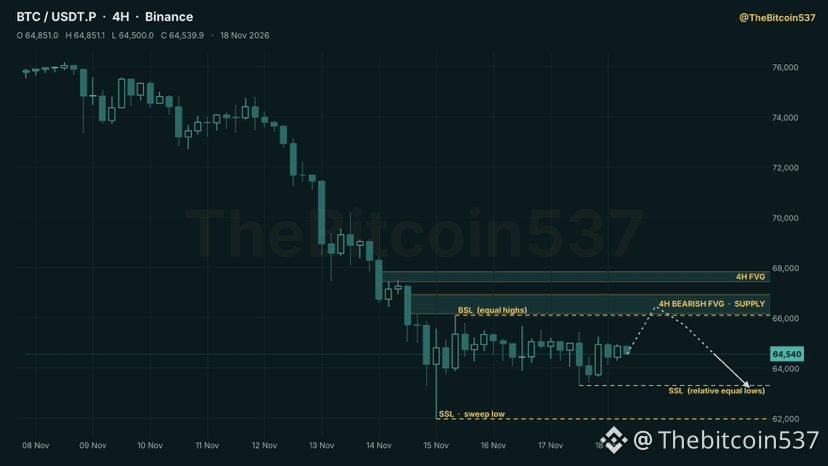
🔻 BTC crashed through $70K. Now basing in the low $60Ks.
🟠 BTC — $64,680
Since our last update ($74,271 on 9 Nov), BTC fell another 17%.
→ 12 Nov: lost the $72,400–73,300 support
→ 13–14 Nov: two heavy red days (−4.4%, −6.1%) on the biggest volume of this whole move
→ 15 Nov: flushed to $61,956, then closed green at $65,310 with a long wick below
For three days since, it's been stuck between $63,300 and $65,700.
Down 22% in 30 days. Six red weeks in a row.
❓ Why:
→ Hot US inflation revived fears of a December rate hike
→ Reports about Nvidia's leadership hit tech stocks
→ But BTC fell far more than stocks — the real damage was leverage. Open interest dropped 19% and nearly $1B of longs got liquidated
→ Spot BTC ETFs kept bleeding: −$765M over five days
📏 Levels:
→ Resistance: $65,500–65,700, then $67,250 (top of the summer range)
→ Support: $63,300, then the $61,956 low
→ Below that: $58,000 — the June–August lows
The weekly gap we flagged on 9 Nov (down to the mid-$60Ks) is now filled.
🔷 ETH — $1,814 🔻
Lost $2,000. Low $1,710. Now basing between $1,750 and $1,866.
💵 USDT Dominance — 8.04% 🔺
Broke above 8% for the first time (peak 8.39%). Flat for four days — panic has stopped rising, but money hasn't come back.
👑 BTC Dominance — 59.6% 🔻
Slipped under 60%. Alts are no longer falling faster than BTC.
🪙 Altcoins (TOTAL3) — $658B
Low $631B. Up about 4% from the bottom.
📌 Bottom line:
This was a leverage flush — the kind that often marks a short-term low. The long-wick close on 15 Nov and three quiet days since support that.
But every higher timeframe is still in a downtrend.
👉 Reclaim $65,700 = relief bounce toward $67,250.
Lose $61,956 = next stop $58,000.
No catching knives — let a bottom prove itself first.
📊 CRYPTO MARKET UPDATE — 18 Nov
🔻 BTC crashed through $70K. Now basing in the low $60Ks.
🟠 BTC — $64,680
Since our last update ($74,271 on 9 Nov), BTC fell another 17%.
→ 12 Nov: lost the $72,400–73,300 support
→ 13–14 Nov: two heavy red days (−4.4%, −6.1%) on the biggest volume of this whole move
→ 15 Nov: flushed to $61,956, then closed green at $65,310 with a long wick below
For three days since, it's been stuck between $63,300 and $65,700.
Down 22% in 30 days. Six red weeks in a row.
❓ Why:
→ Hot US inflation revived fears of a December rate hike
→ Reports about Nvidia's leadership hit tech stocks
→ But BTC fell far more than stocks — the real damage was leverage. Open interest dropped 19% and nearly $1B of longs got liquidated
→ Spot BTC ETFs kept bleeding: −$765M over five days
📏 Levels:
→ Resistance: $65,500–65,700, then $67,250 (top of the summer range)
→ Support: $63,300, then the $61,956 low
→ Below that: $58,000 — the June–August lows
The weekly gap we flagged on 9 Nov (down to the mid-$60Ks) is now filled.
🔷 ETH — $1,814 🔻
Lost $2,000. Low $1,710. Now basing between $1,750 and $1,866.
💵 USDT Dominance — 8.04% 🔺
Broke above 8% for the first time (peak 8.39%). Flat for four days — panic has stopped rising, but money hasn't come back.
👑 BTC Dominance — 59.6% 🔻
Slipped under 60%. Alts are no longer falling faster than BTC.
🪙 Altcoins (TOTAL3) — $658B
Low $631B. Up about 4% from the bottom.
📌 Bottom line:
This was a leverage flush — the kind that often marks a short-term low. The long-wick close on 15 Nov and three quiet days since support that.
But every higher timeframe is still in a downtrend.
👉 Reclaim $65,700 = relief bounce toward $67,250.
Lose $61,956 = next stop $58,000.
No catching knives — let a bottom prove itself first.