
$SUI 𝗕𝗘𝗟𝗢𝗪 $0.75. 𝗧𝗛𝗘 𝗟𝗘𝗩𝗘𝗟 𝗧𝗛𝗔𝗧 𝗗𝗘𝗖𝗜𝗗𝗘𝗦 𝗧𝗛𝗘 𝗡𝗘𝗫𝗧 𝟮𝟬%.
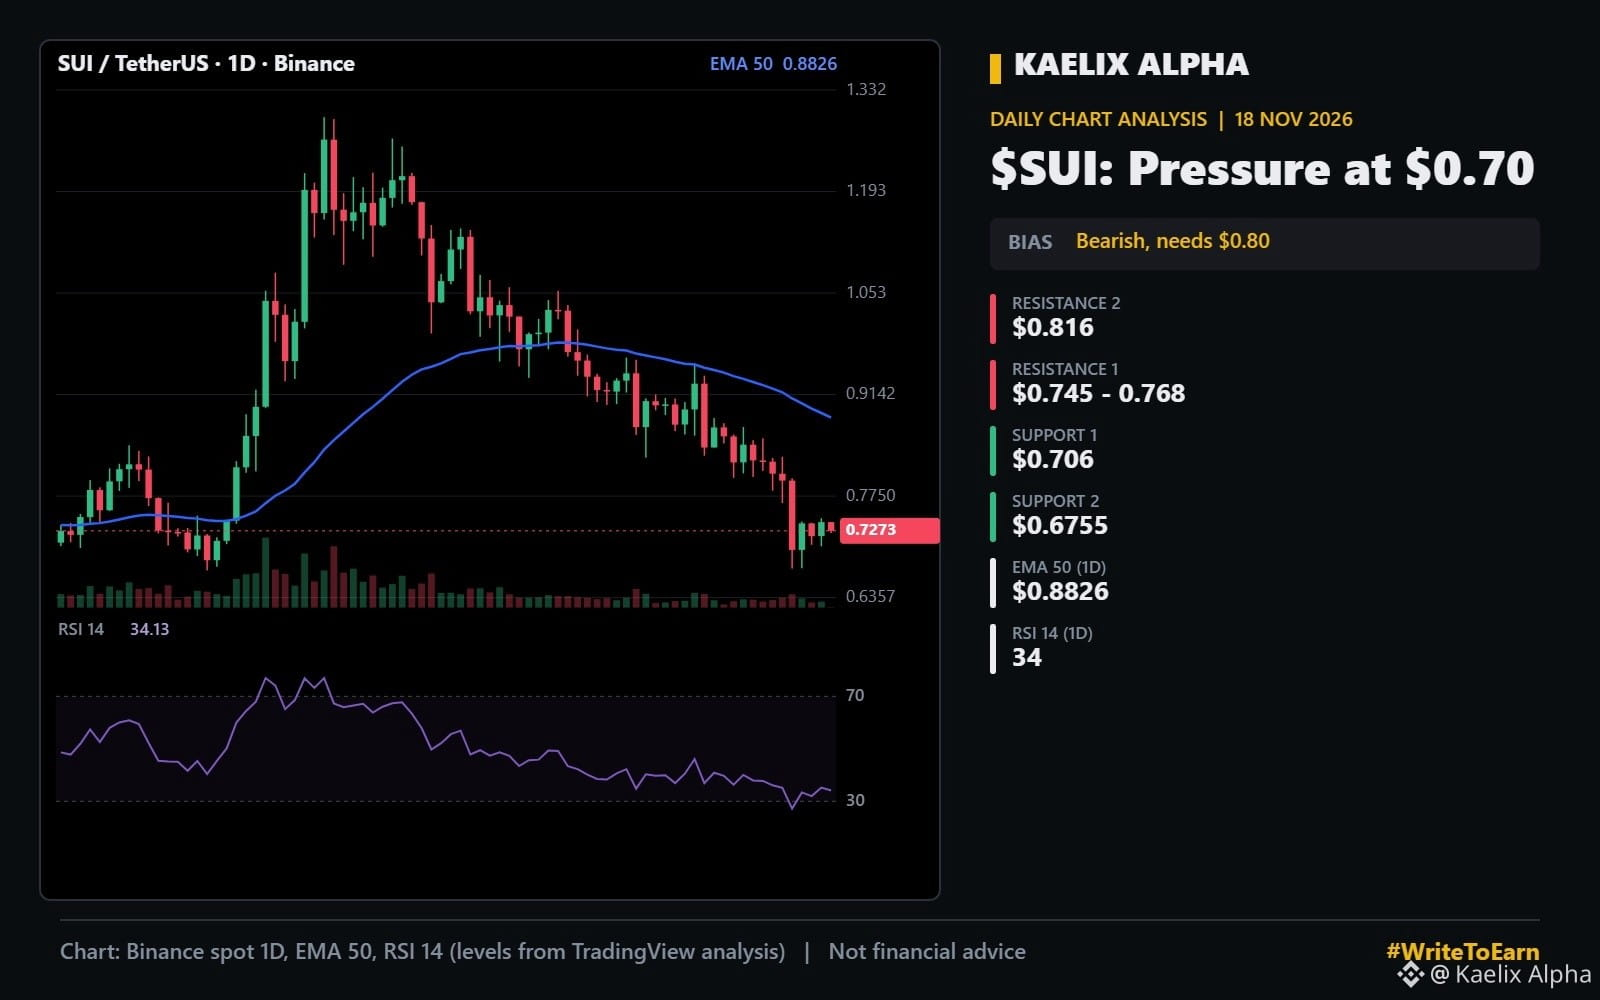
SUI is down 27% in a month and 44% from its September high of $1.29. TradingView breakdown:
𝗧𝗵𝗲 𝘀𝘁𝗿𝘂𝗰𝘁𝘂𝗿𝗲
SUI lost the 50-day EMA (around $0.88) in mid-October and has stair-stepped lower since. This week's low at $0.6755 matches the September base, which makes it a key support.
𝗧𝗵𝗲 𝗺𝗼𝗺𝗲𝗻𝘁𝘂𝗺
Daily RSI is 34. Not deeply oversold, which tells me SUI has been selling off in an orderly way rather than crashing.
𝗞𝗲𝘆 𝗹𝗲𝘃𝗲𝗹𝘀
Resistance: $0.745, then $0.768 (4H 50 EMA), then $0.816 (20-day EMA)
Support: $0.706, then $0.6755
Trend line: 50-day EMA $0.8826
𝗠𝘆 𝗽𝗹𝗮𝗻
Hold $0.6755 and reclaim $0.768, and a move to $0.816 (about 12% higher) is on the table. Lose $0.6755, and the September base breaks, which could mean another 15% to 20% lower.
Bullish or bearish on SUI this month?
#WriteToEarn #Write2Earn #SUI #Altcoins #TechnicalAnalysis
Not financial advice. Do your own research.
SUI is down 27% in a month and 44% from its September high of $1.29. TradingView breakdown:
𝗧𝗵𝗲 𝘀𝘁𝗿𝘂𝗰𝘁𝘂𝗿𝗲
SUI lost the 50-day EMA (around $0.88) in mid-October and has stair-stepped lower since. This week's low at $0.6755 matches the September base, which makes it a key support.
𝗧𝗵𝗲 𝗺𝗼𝗺𝗲𝗻𝘁𝘂𝗺
Daily RSI is 34. Not deeply oversold, which tells me SUI has been selling off in an orderly way rather than crashing.
𝗞𝗲𝘆 𝗹𝗲𝘃𝗲𝗹𝘀
Resistance: $0.745, then $0.768 (4H 50 EMA), then $0.816 (20-day EMA)
Support: $0.706, then $0.6755
Trend line: 50-day EMA $0.8826
𝗠𝘆 𝗽𝗹𝗮𝗻
Hold $0.6755 and reclaim $0.768, and a move to $0.816 (about 12% higher) is on the table. Lose $0.6755, and the September base breaks, which could mean another 15% to 20% lower.
Bullish or bearish on SUI this month?
#WriteToEarn #Write2Earn #SUI #Altcoins #TechnicalAnalysis
Not financial advice. Do your own research.