
$BNB 𝗙𝗘𝗟𝗟 𝟭𝟵% 𝗜𝗡 𝗔 𝗠𝗢𝗡𝗧𝗛. 𝗛𝗘𝗥𝗘 𝗜𝗦 𝗪𝗛𝗘𝗥𝗘 𝗧𝗛𝗘 𝗕𝗨𝗬𝗘𝗥𝗦 𝗔𝗥𝗘.
BNB has been one of the steadier large caps all year, but this sell-off hit it too. TradingView breakdown:
𝗧𝗵𝗲 𝘀𝘁𝗿𝘂𝗰𝘁𝘂𝗿𝗲
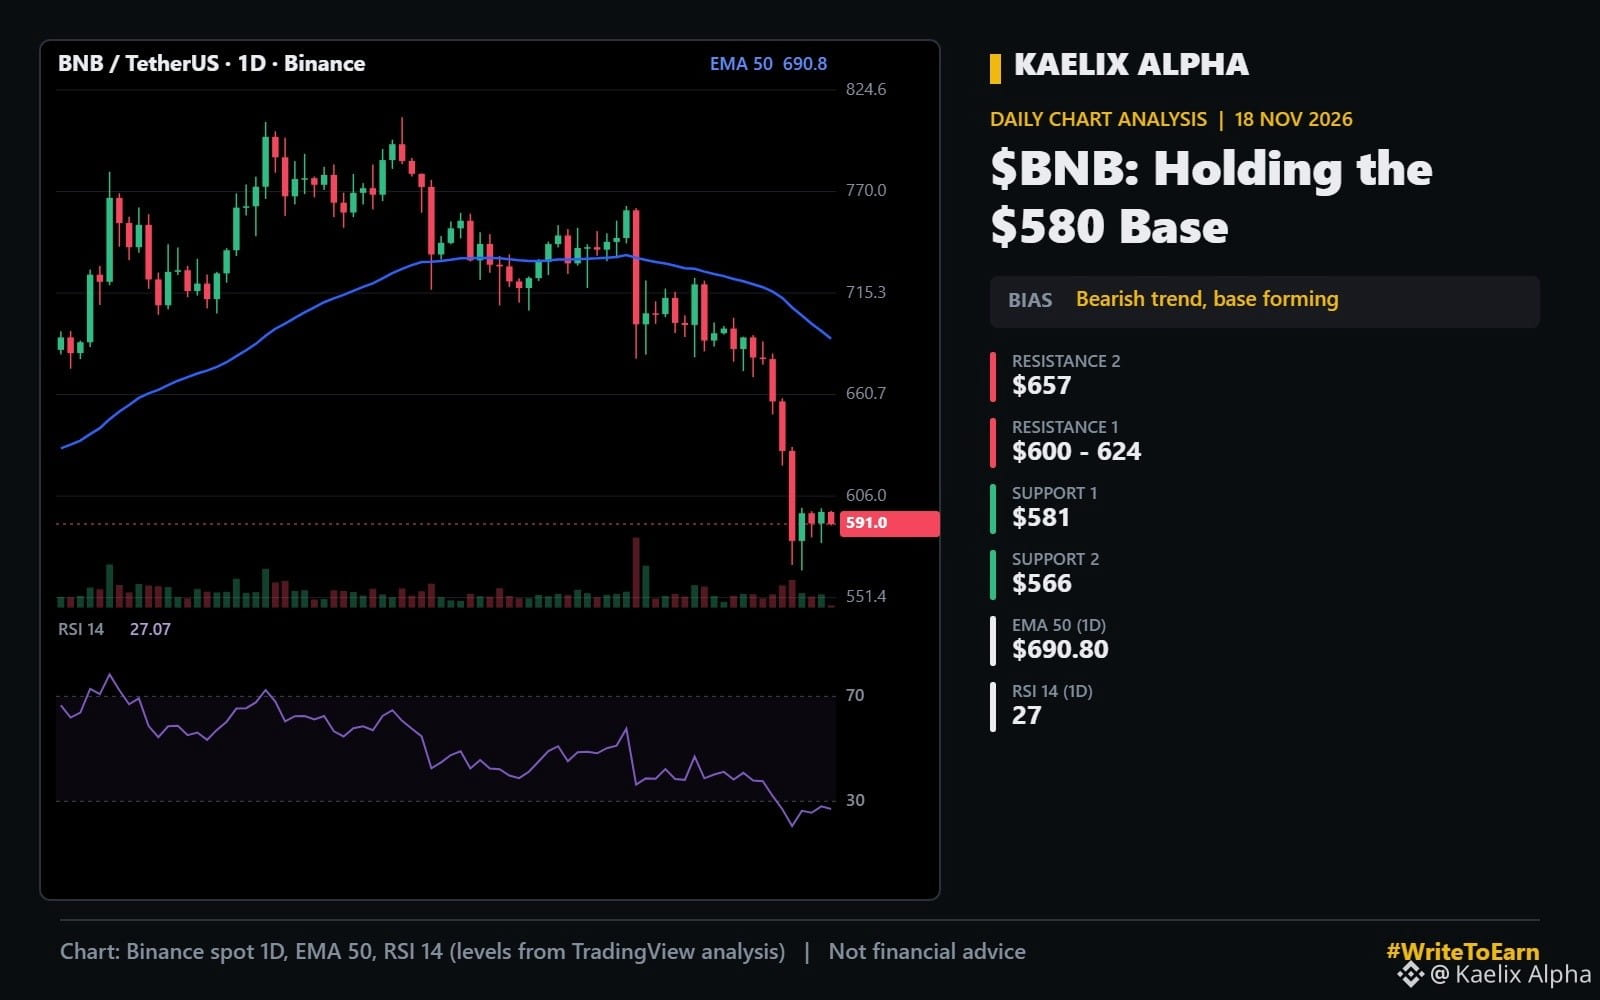
BNB broke down from its $700 to $760 range on 14 November and crashed to $566. Since then, it has built a small base between $580 and $600 for four days.
𝗧𝗵𝗲 𝗺𝗼𝗺𝗲𝗻𝘁𝘂𝗺
Daily RSI is at 27. The 50-day EMA sits far above at $690.80, so the trend is still down.
𝗞𝗲𝘆 𝗹𝗲𝘃𝗲𝗹𝘀
Resistance: $600, then $624 (4H 50 EMA), then $657
Support: $581, then $566
The trigger: a daily close above $624
𝗛𝗼𝘄 𝗜 𝘀𝗲𝗲 𝗶𝘁
Four days of sideways action after a crash usually means the panic selling is done. The question is whether it is accumulation or just a pause before another leg.
If $566 holds, I expect a relief move toward $624 to $657.
Holding BNB through this? Let me know.
#WriteToEarn #Write2Earn #BNB #BinanceCoin #TechnicalAnalysis
Not financial advice. Do your own research.
BNB has been one of the steadier large caps all year, but this sell-off hit it too. TradingView breakdown:
𝗧𝗵𝗲 𝘀𝘁𝗿𝘂𝗰𝘁𝘂𝗿𝗲
BNB broke down from its $700 to $760 range on 14 November and crashed to $566. Since then, it has built a small base between $580 and $600 for four days.
𝗧𝗵𝗲 𝗺𝗼𝗺𝗲𝗻𝘁𝘂𝗺
Daily RSI is at 27. The 50-day EMA sits far above at $690.80, so the trend is still down.
𝗞𝗲𝘆 𝗹𝗲𝘃𝗲𝗹𝘀
Resistance: $600, then $624 (4H 50 EMA), then $657
Support: $581, then $566
The trigger: a daily close above $624
𝗛𝗼𝘄 𝗜 𝘀𝗲𝗲 𝗶𝘁
Four days of sideways action after a crash usually means the panic selling is done. The question is whether it is accumulation or just a pause before another leg.
If $566 holds, I expect a relief move toward $624 to $657.
Holding BNB through this? Let me know.
#WriteToEarn #Write2Earn #BNB #BinanceCoin #TechnicalAnalysis
Not financial advice. Do your own research.