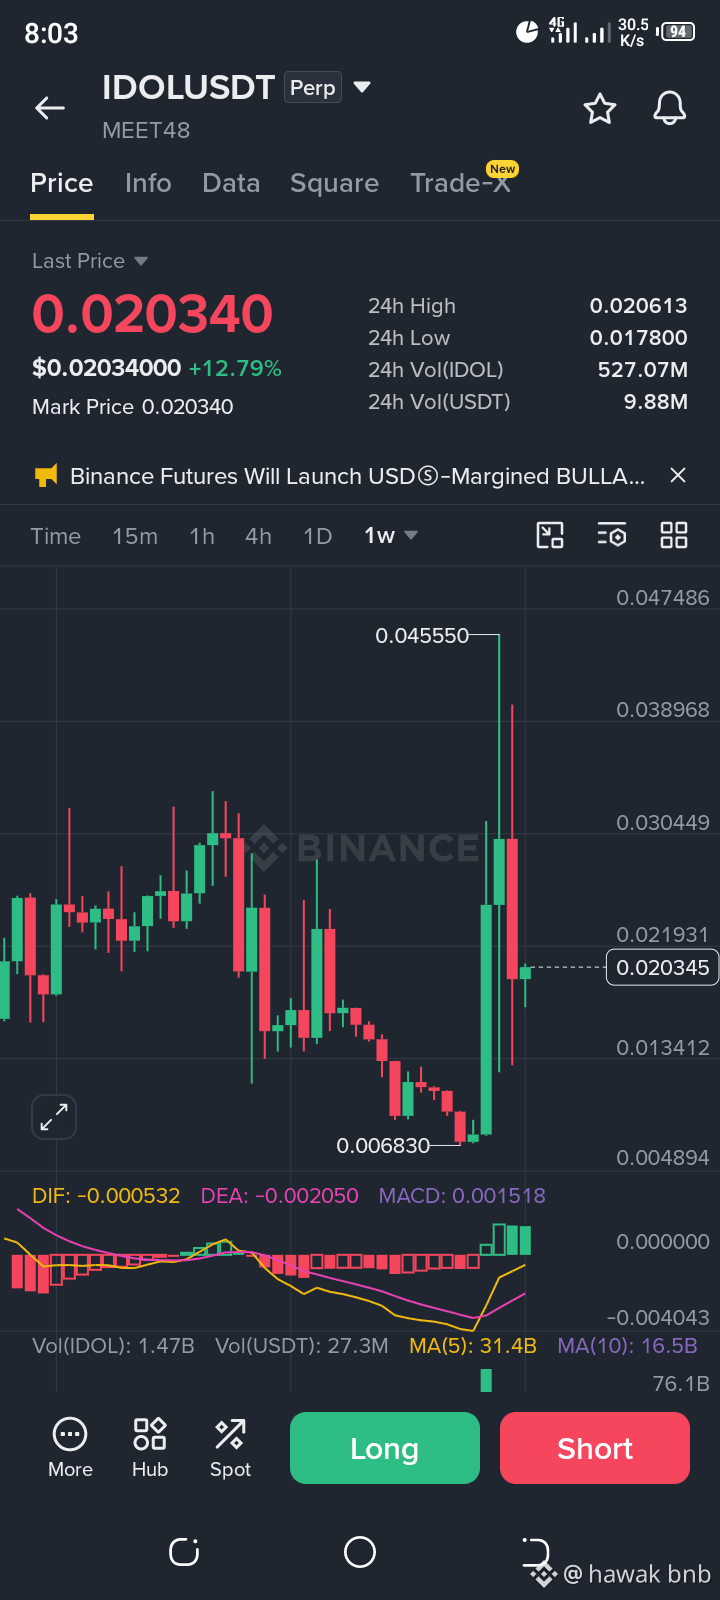
The screenshot displays a 1-week (1W) technical candlestick chart for IDOL/USDT (MEET48) on Binance. The current last traded price stands at $0.020340, reflecting a solid weekly increase of +12.79%. Following a prolonged period of downward pressure that established a macro low of $0.006830, the asset formed an aggressive bullish recovery candle, surging sharply toward a peak of $0.045550 before retracing to its current mid-range level.
24-Hour Range & Trading Volume
Over the recent 24-hour trading window, IDOL recorded a low of $0.017800 and a high of $0.020613. Market liquidity and trading participation are robust, supported by a 24-hour trading volume of 527.07M IDOL and 9.88M USDT. An announcement ticker at the top also notes ongoing updates, indicating that Binance Futures continues to expand its offerings with new contract launches.
Technical Indicators (MACD & Moving Averages)
MACD: In the lower panel, the MACD indicator displays values of DIF: -0.000532, DEA: -0.002050, and MACD: 0.001518. The MACD histogram has turned positive with expanding green bars, and the DIF line has crossed upward above the DEA line, signaling a shift toward bullish momentum on the higher timeframe.
Volume Moving Averages: Volume moving averages show MA(5) at 31.4B compared to MA(10) at 16.5B, highlighting a massive expansion in trading volume backing the recent price breakout. @Idol #IDOLUSTD $IDOL
#CanNvidia’sDataCenterGrowthContinue? #NvidiaBoardNotConsideringHuang’sReturnasCEO #AnthropicClearedToListOnNasdaqAsANT #WhatInvestmentSignalsDo13FFilingsReveal?
24-Hour Range & Trading Volume
Over the recent 24-hour trading window, IDOL recorded a low of $0.017800 and a high of $0.020613. Market liquidity and trading participation are robust, supported by a 24-hour trading volume of 527.07M IDOL and 9.88M USDT. An announcement ticker at the top also notes ongoing updates, indicating that Binance Futures continues to expand its offerings with new contract launches.
Technical Indicators (MACD & Moving Averages)
MACD: In the lower panel, the MACD indicator displays values of DIF: -0.000532, DEA: -0.002050, and MACD: 0.001518. The MACD histogram has turned positive with expanding green bars, and the DIF line has crossed upward above the DEA line, signaling a shift toward bullish momentum on the higher timeframe.
Volume Moving Averages: Volume moving averages show MA(5) at 31.4B compared to MA(10) at 16.5B, highlighting a massive expansion in trading volume backing the recent price breakout. @Idol #IDOLUSTD $IDOL
#CanNvidia’sDataCenterGrowthContinue? #NvidiaBoardNotConsideringHuang’sReturnasCEO #AnthropicClearedToListOnNasdaqAsANT #WhatInvestmentSignalsDo13FFilingsReveal?