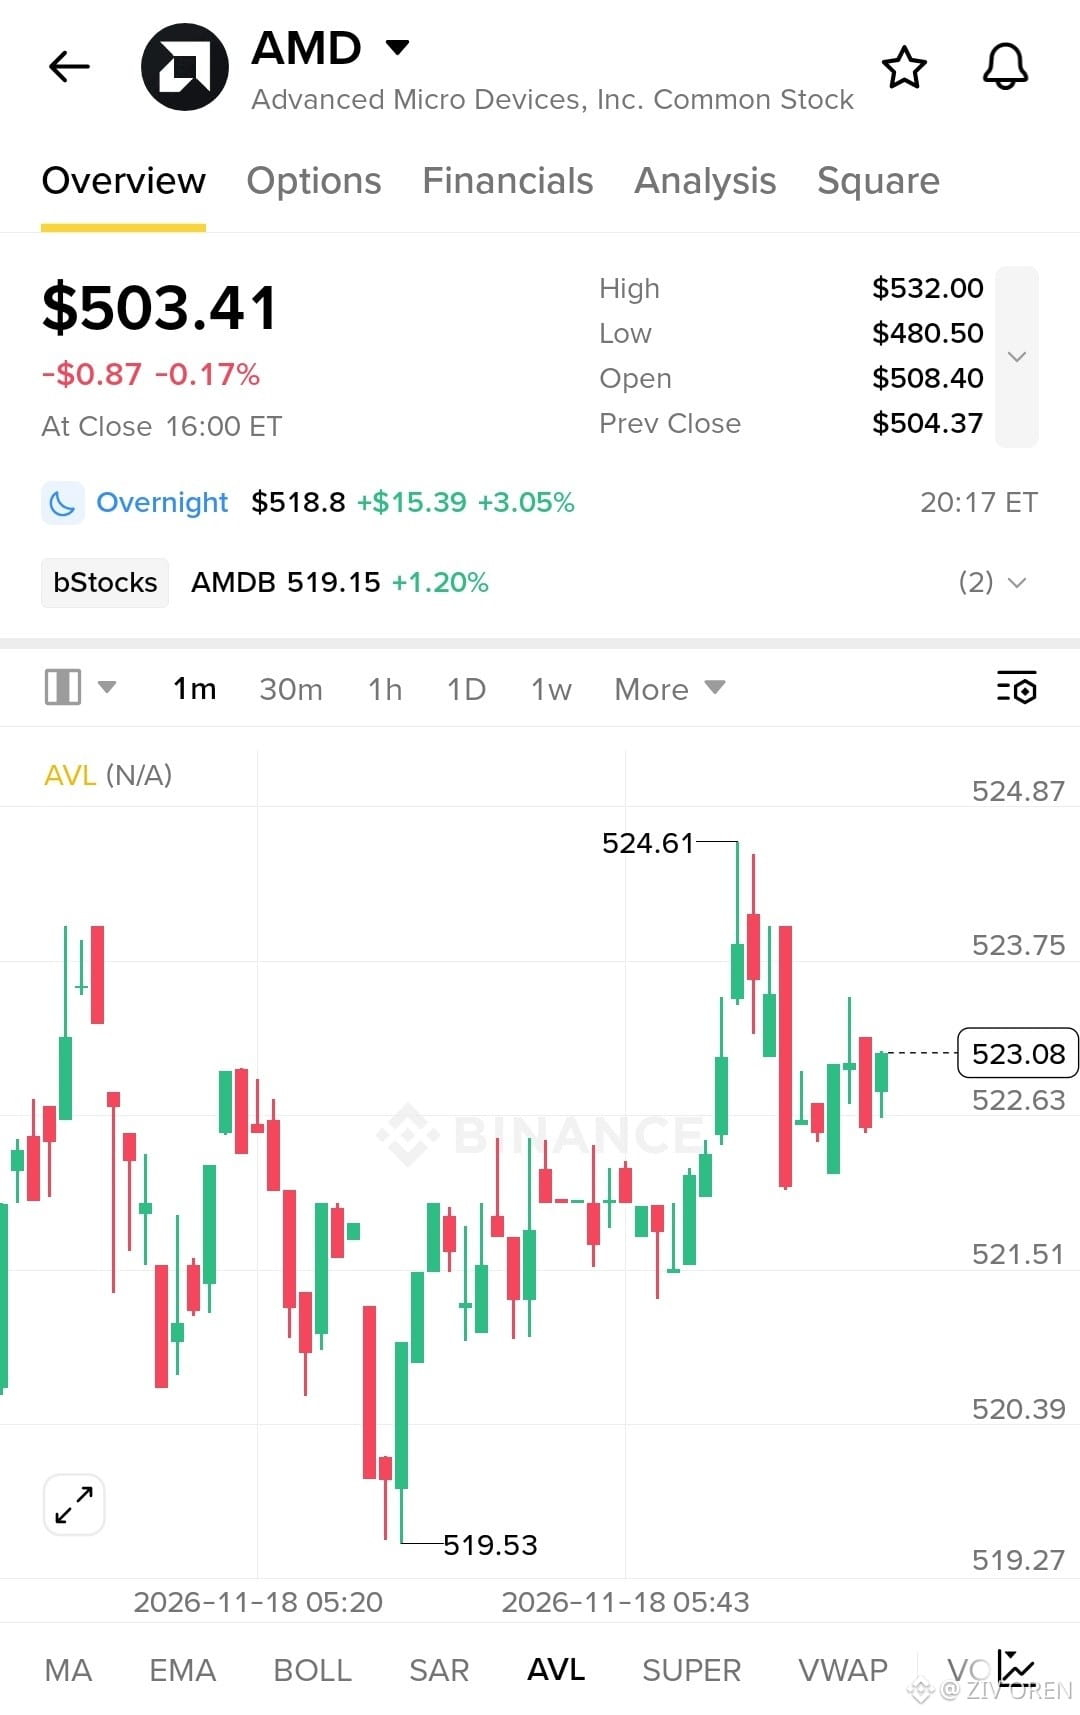

I'm keeping a close eye on $AMD . The stock closed at $503.41, down just 0.17%, but overnight trading shows a strong recovery toward $518.80, up approximately 3.05%.
On the 1-minute chart, buyers pushed the price from $519.53 to $524.61 before facing some selling pressure. AMD is now consolidating around $523.08. This suggests buyers are stepping back in, but I want to see confirmation before calling it a fresh breakout.
Market Activity
* Previous Close: $504.37
* Regular Session High: $532.00
* Regular Session Low: $480.50
* Overnight Price: $518.80
* Overnight Change: +3.05%
* Chart High: $524.61
* Current Chart Price: $523.08
My Trading Plan
I'm interested in a long position if AMD maintains its short-term recovery.
* Entry Zone: $521.50–$522.50
* DCA 1: $520.50
* DCA 2: $519.50
* TP1: $524.60
* TP2: $527.00
* TP3: $530.00
* Stop Loss: $518.80
I would prefer a clean break above $524.61 with strong buying pressure before adding to the position. A drop below $519.50 would weaken this short-term setup.
My focus is on whether AMD can turn $524.61 into support. If buyers manage that, another move toward $530 becomes interesting. I'm watching the confirmation, not chasing the candles.
On the 1-minute chart, buyers pushed the price from $519.53 to $524.61 before facing some selling pressure. AMD is now consolidating around $523.08. This suggests buyers are stepping back in, but I want to see confirmation before calling it a fresh breakout.
Market Activity
* Previous Close: $504.37
* Regular Session High: $532.00
* Regular Session Low: $480.50
* Overnight Price: $518.80
* Overnight Change: +3.05%
* Chart High: $524.61
* Current Chart Price: $523.08
My Trading Plan
I'm interested in a long position if AMD maintains its short-term recovery.
* Entry Zone: $521.50–$522.50
* DCA 1: $520.50
* DCA 2: $519.50
* TP1: $524.60
* TP2: $527.00
* TP3: $530.00
* Stop Loss: $518.80
I would prefer a clean break above $524.61 with strong buying pressure before adding to the position. A drop below $519.50 would weaken this short-term setup.
My focus is on whether AMD can turn $524.61 into support. If buyers manage that, another move toward $530 becomes interesting. I'm watching the confirmation, not chasing the candles.