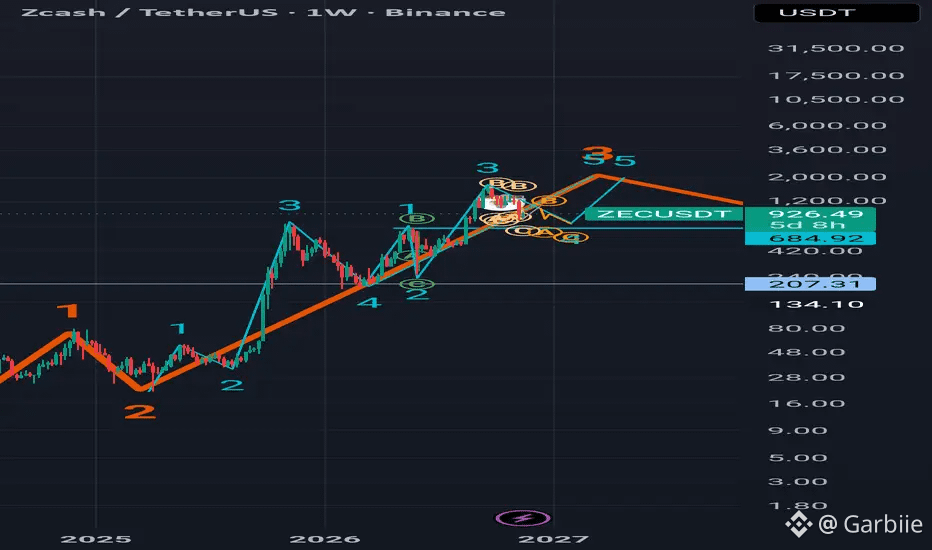
$ZEC is an interesting chart to watch right now.
Looking at it through Elliott Wave Theory, the key is understanding where we are in the current wave structure and what that could mean for the next move.
I'm not interested in chasing every green candle. I want to see how price develops, whether the wave structure remains valid, and where the next meaningful opportunity could emerge.
Elliott Wave isn't about predicting every move perfectly. It's about mapping possible scenarios and managing risk accordingly.
Keeping $ZEC on my watchlist. $ZEC
Looking at it through Elliott Wave Theory, the key is understanding where we are in the current wave structure and what that could mean for the next move.
I'm not interested in chasing every green candle. I want to see how price develops, whether the wave structure remains valid, and where the next meaningful opportunity could emerge.
Elliott Wave isn't about predicting every move perfectly. It's about mapping possible scenarios and managing risk accordingly.
Keeping $ZEC on my watchlist. $ZEC