#NvidiaEarningsTonight:AIStocks’NextMove?
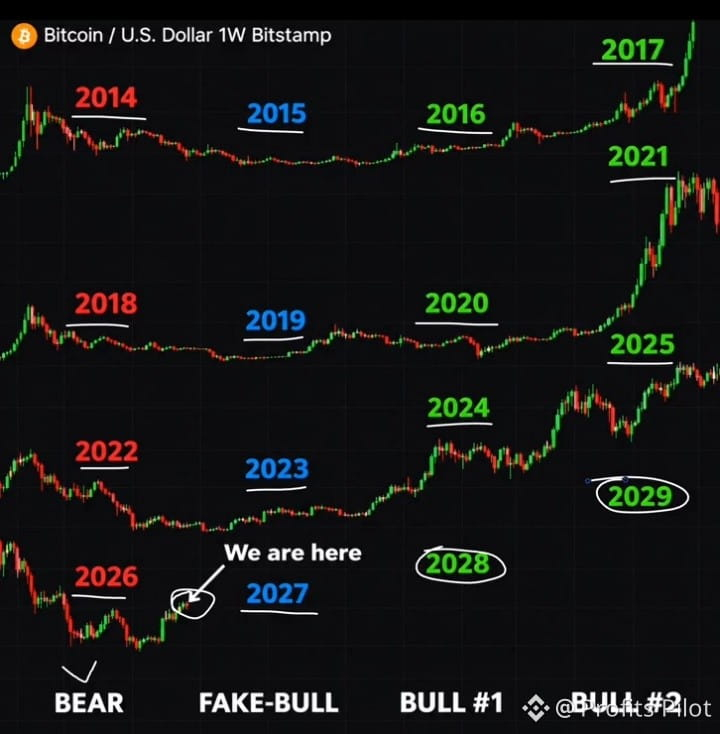
🚨 BITCOIN IS REPEATING THE SAME 4-YEAR #CYCLE FOR THE FOURTH TIME!
If this historical structure continues, 2027 could turn into one of the biggest accumulation opportunities of the decade.
Take a closer look at the chart.
2014 → Bear market
2015 → Fake rally / recovery
2016 → Bull Run #1
2017 → Bull Run #2
2018 → Bear market
2019 → Fake rally / recovery
2020 → Bull Run #1
2021 → Bull Run #2
2022 → Bear market
2023 → Fake rally / recovery
2024 → Bull Run #1
2025 → Bull Run #2 / cycle peak
Now consider what could happen next:
2026 → Bear market
2027 → Fake rally / recovery?
2028 → Bull Run #1?
2029 → Bull Run #2 / new cycle peak?
Three complete cycles have already followed this exact pattern.
And we may be witnessing the fourth one unfold right now.
But there are two major differences that make this cycle particularly interesting.
First, the decline has been significantly smaller.
Previous Bitcoin bear markets saw drawdowns of approximately 77% to 85%.
This time, BTC dropped from $126,000 to $58,600 — a decline of roughly 53%.
Second, the correction happened much quicker.
In previous cycles, Bitcoin needed around 363–406 days to establish its bottom.
This time, BTC reached $58,600 just 268 days after its peak.
So the million-dollar question is:
Has Bitcoin already established its cycle bottom at $58,600?
Or is one last wave of capitulation still ahead before the true recovery begins?
If history follows the same script, 2027 could be when smart money quietly accumulates while the majority still believes Bitcoin is finished.
And if the cycle remains intact:
2027 → Recovery
2028 → Bullish expansion
2029 → Potential new cycle peak
Remember:
Past performance does NOT guarantee future results.
But overlooking a historical pattern this consistent could prove to be a costly mistake.
Save this chart.
Come back and check it in 2027. 🚀
$BTC $HUMA $ZEC
#AnthropicIPOTestsInvestorAppetiteForAI
🚨 BITCOIN IS REPEATING THE SAME 4-YEAR #CYCLE FOR THE FOURTH TIME!
If this historical structure continues, 2027 could turn into one of the biggest accumulation opportunities of the decade.
Take a closer look at the chart.
2014 → Bear market
2015 → Fake rally / recovery
2016 → Bull Run #1
2017 → Bull Run #2
2018 → Bear market
2019 → Fake rally / recovery
2020 → Bull Run #1
2021 → Bull Run #2
2022 → Bear market
2023 → Fake rally / recovery
2024 → Bull Run #1
2025 → Bull Run #2 / cycle peak
Now consider what could happen next:
2026 → Bear market
2027 → Fake rally / recovery?
2028 → Bull Run #1?
2029 → Bull Run #2 / new cycle peak?
Three complete cycles have already followed this exact pattern.
And we may be witnessing the fourth one unfold right now.
But there are two major differences that make this cycle particularly interesting.
First, the decline has been significantly smaller.
Previous Bitcoin bear markets saw drawdowns of approximately 77% to 85%.
This time, BTC dropped from $126,000 to $58,600 — a decline of roughly 53%.
Second, the correction happened much quicker.
In previous cycles, Bitcoin needed around 363–406 days to establish its bottom.
This time, BTC reached $58,600 just 268 days after its peak.
So the million-dollar question is:
Has Bitcoin already established its cycle bottom at $58,600?
Or is one last wave of capitulation still ahead before the true recovery begins?
If history follows the same script, 2027 could be when smart money quietly accumulates while the majority still believes Bitcoin is finished.
And if the cycle remains intact:
2027 → Recovery
2028 → Bullish expansion
2029 → Potential new cycle peak
Remember:
Past performance does NOT guarantee future results.
But overlooking a historical pattern this consistent could prove to be a costly mistake.
Save this chart.
Come back and check it in 2027. 🚀
$BTC $HUMA $ZEC
#AnthropicIPOTestsInvestorAppetiteForAI