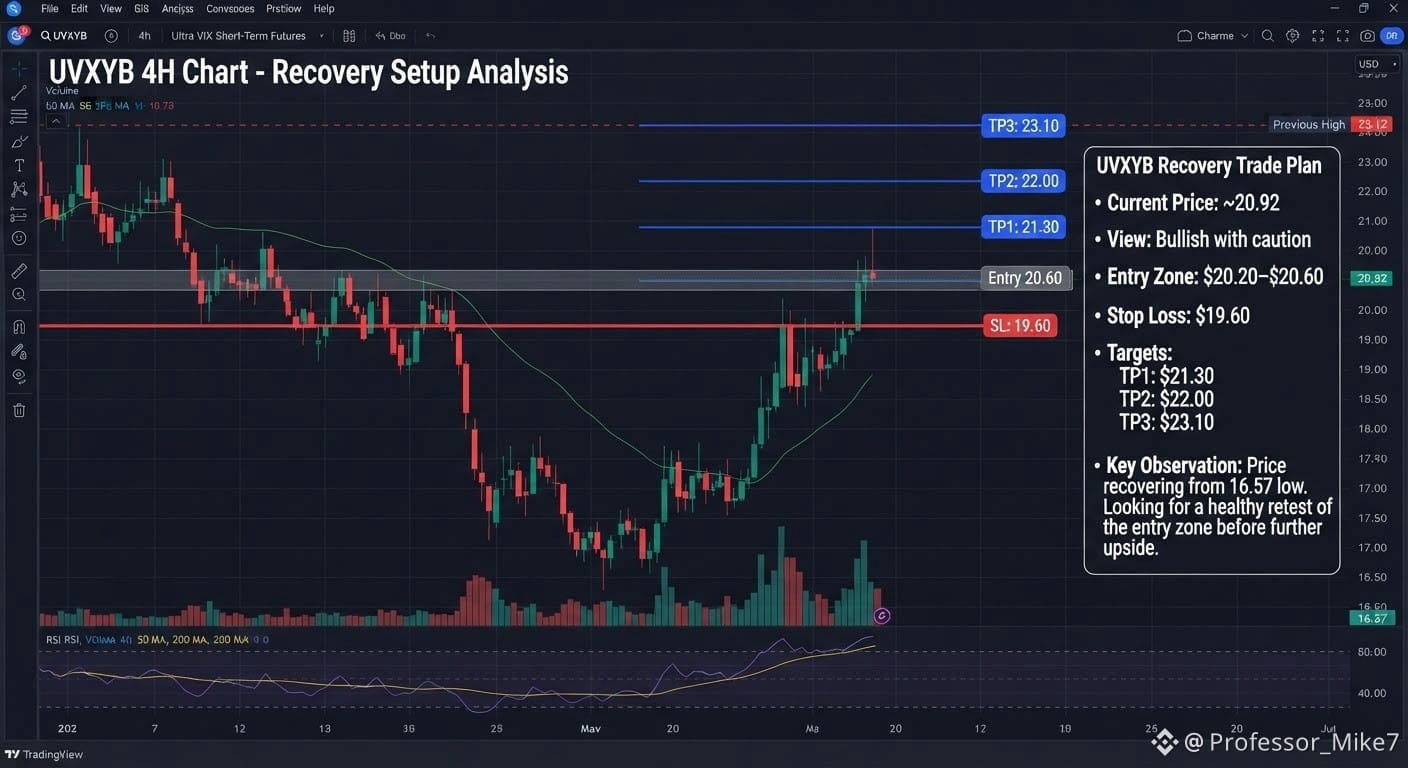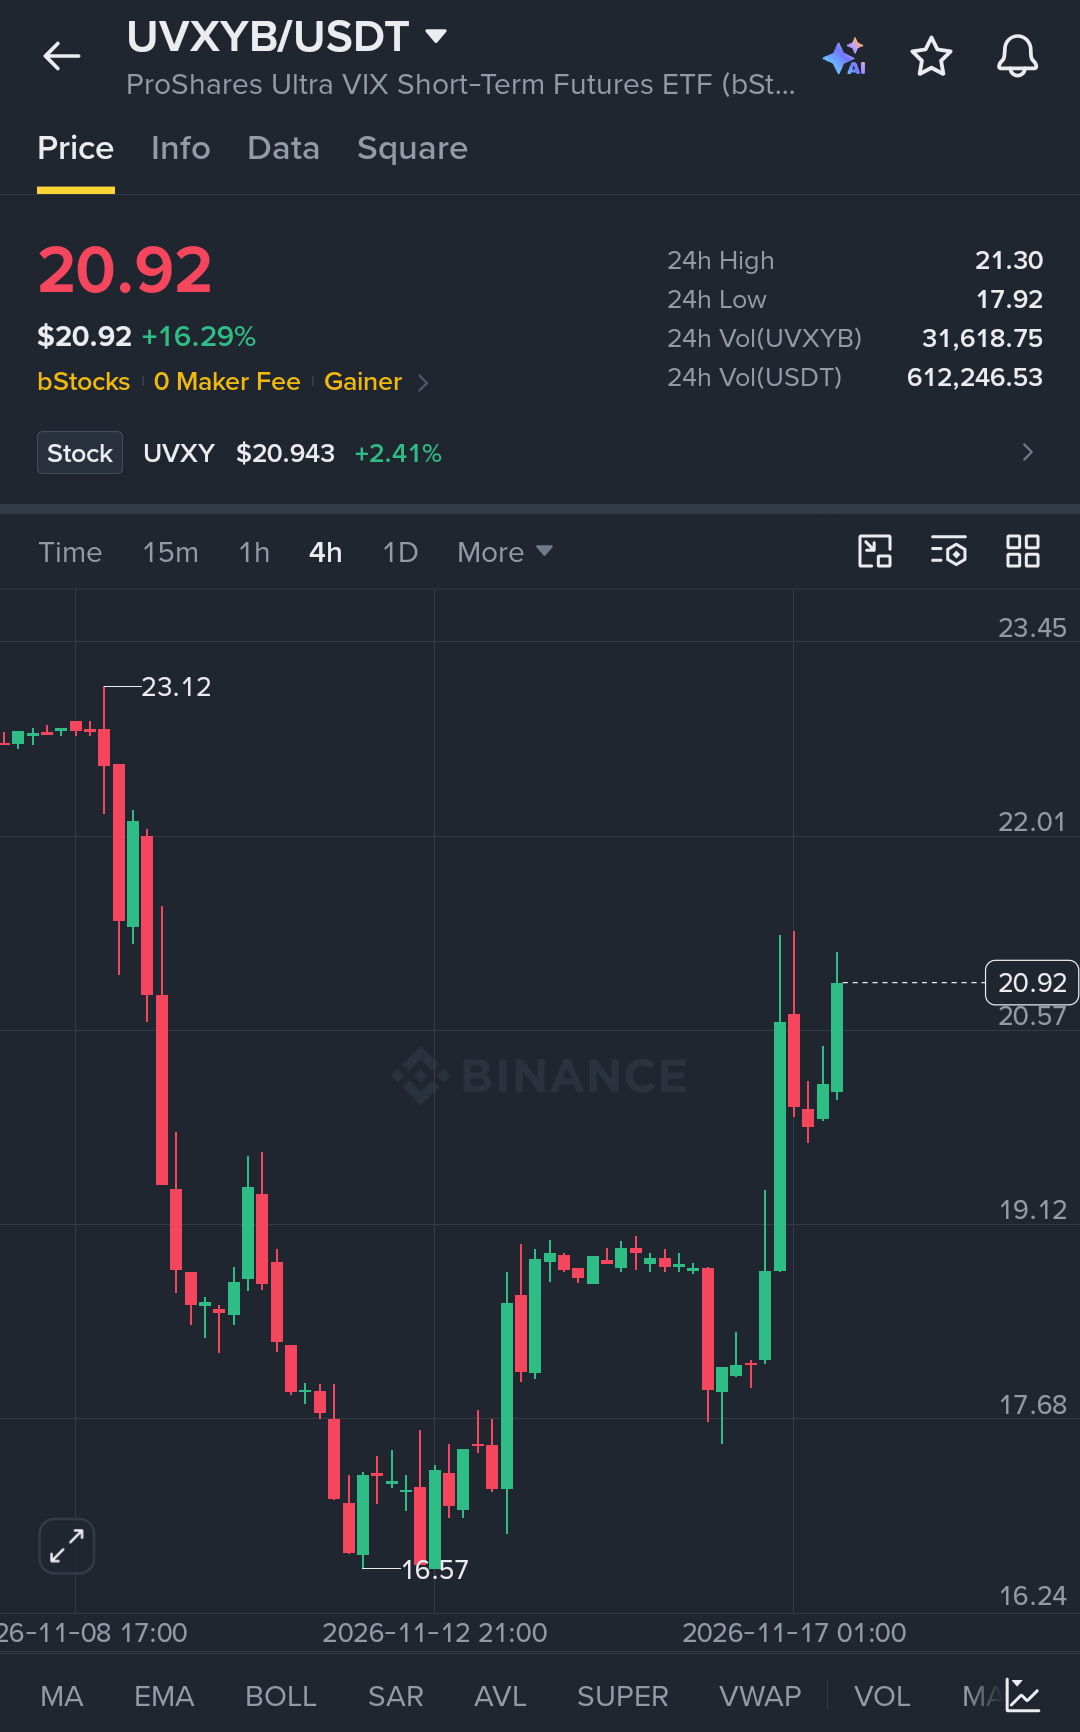
I was watching $UVXYB closely and this 4H chart is starting to show an interesting recovery story. After dropping from the 23.12 area to a low of 16.57, buyers have finally stepped in with serious strength. What caught my attention is the sharp bullish move from the 17.70–19.00 region, followed by a successful push back toward 20.92.
The momentum looks promising, but I don't want to chase a candle after a 16%+ move. A healthy retest would make the next entry much more attractive.
My trading plan:
Entry Zone: $20.20–$20.60
TP1: $21.30
TP2: $22.00
TP3: $23.10
Stop Loss: $19.60
The first major challenge is around $21.30. If buyers manage to break this level and hold above it on the 4H timeframe, we could see another push toward $22.00 and potentially the previous high near $23.12.
On the downside, losing the $20.00 area would weaken the immediate bullish setup. A break below $19.60 would invalidate my planned trade.
My pro tip: Don't enter just because the candles are green. Wait for a proper retest, watch buying volume, and look for a strong 4H closing candle before committing.
One thing I've learned from trading volatile assets is that protecting capital matters more than catching every pump.
UVXYB is showing recovery potential, but confirmation is still important. Trade the setup, not the excitement.
$UVXYB
$HUMA
#InvescoStablecoinReservesFundLaunchesOnEthereum #WhatInvestmentSignalsDo13FFilingsReveal? #NvidiaBoardNotConsideringHuang’sReturnasCEO #AnthropicIPOTestsInvestorAppetiteForAI
The momentum looks promising, but I don't want to chase a candle after a 16%+ move. A healthy retest would make the next entry much more attractive.
My trading plan:
Entry Zone: $20.20–$20.60
TP1: $21.30
TP2: $22.00
TP3: $23.10
Stop Loss: $19.60
The first major challenge is around $21.30. If buyers manage to break this level and hold above it on the 4H timeframe, we could see another push toward $22.00 and potentially the previous high near $23.12.
On the downside, losing the $20.00 area would weaken the immediate bullish setup. A break below $19.60 would invalidate my planned trade.
My pro tip: Don't enter just because the candles are green. Wait for a proper retest, watch buying volume, and look for a strong 4H closing candle before committing.
One thing I've learned from trading volatile assets is that protecting capital matters more than catching every pump.
UVXYB is showing recovery potential, but confirmation is still important. Trade the setup, not the excitement.
$UVXYB
$HUMA
#InvescoStablecoinReservesFundLaunchesOnEthereum #WhatInvestmentSignalsDo13FFilingsReveal? #NvidiaBoardNotConsideringHuang’sReturnasCEO #AnthropicIPOTestsInvestorAppetiteForAI