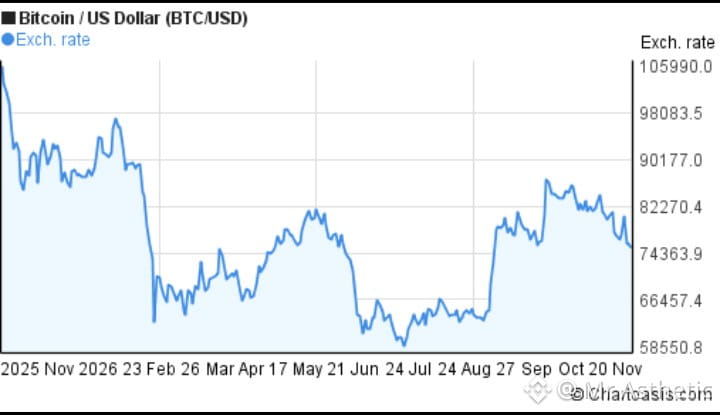
$BTC is trading near $64,900, bouncing from a sharp selloff but still in a downtrend. The 24-hour range was roughly $63,900–$65,500. Last week's drop touched about $62,000, the lowest since July, and cost more than 12% on the week.
Here are chart pictures to follow along (they're live-style charts, so check the latest candles yourself):
What the chart says
Trend: Price is below the 7-, 20-, 50- and 200-day averages (about $68.8K, $74.4K, $79.4K and $72.9K). It has also closed below the weekly 200 MA, leaving the rising trendline from the 2022 lows as the main long-term support.
Momentum: Daily RSI is about 23.6, deeply oversold, and price is hugging the lower Bollinger band near $64.5K. That favors a reflex bounce, not a confirmed bottom.
Fib zone: BTC sits on the 0.786 retracement near $64K, which overlaps the August demand zone.
Key levels
Support: $62K–$62.5K, then $60K. A daily close below $62K would expose $58K–$60K, with $54K below that.
Resistance: about $66K (the recent high), then $68K–$70K, where the breakdown accelerated.
Short-term range: roughly $63K–$68K.
Drivers
Spot Bitcoin ETFs had seven straight sessions of outflows.
Hot inflation data has markets expecting another Fed rate hike in December.
Outlook: The bias is bearish to neutral. A relief bounce toward $68K–$70K is plausible given how oversold it is, but sellers are likely waiting there. Losing $62K would shift risk toward $58K–$60K. A move back above $68K would be the first sign of control shifting to buyers.
This is a summary of public analysis, not financial advice.#AnthropicIPOTestsInvestorAppetiteForAI #BitcoinExtendsLosingStreakToSixWeeks #NvidiaBoardNotConsideringHuang’sReturnasCEO
Here are chart pictures to follow along (they're live-style charts, so check the latest candles yourself):
What the chart says
Trend: Price is below the 7-, 20-, 50- and 200-day averages (about $68.8K, $74.4K, $79.4K and $72.9K). It has also closed below the weekly 200 MA, leaving the rising trendline from the 2022 lows as the main long-term support.
Momentum: Daily RSI is about 23.6, deeply oversold, and price is hugging the lower Bollinger band near $64.5K. That favors a reflex bounce, not a confirmed bottom.
Fib zone: BTC sits on the 0.786 retracement near $64K, which overlaps the August demand zone.
Key levels
Support: $62K–$62.5K, then $60K. A daily close below $62K would expose $58K–$60K, with $54K below that.
Resistance: about $66K (the recent high), then $68K–$70K, where the breakdown accelerated.
Short-term range: roughly $63K–$68K.
Drivers
Spot Bitcoin ETFs had seven straight sessions of outflows.
Hot inflation data has markets expecting another Fed rate hike in December.
Outlook: The bias is bearish to neutral. A relief bounce toward $68K–$70K is plausible given how oversold it is, but sellers are likely waiting there. Losing $62K would shift risk toward $58K–$60K. A move back above $68K would be the first sign of control shifting to buyers.
This is a summary of public analysis, not financial advice.#AnthropicIPOTestsInvestorAppetiteForAI #BitcoinExtendsLosingStreakToSixWeeks #NvidiaBoardNotConsideringHuang’sReturnasCEO