BULLA/USDT Technical Analysis
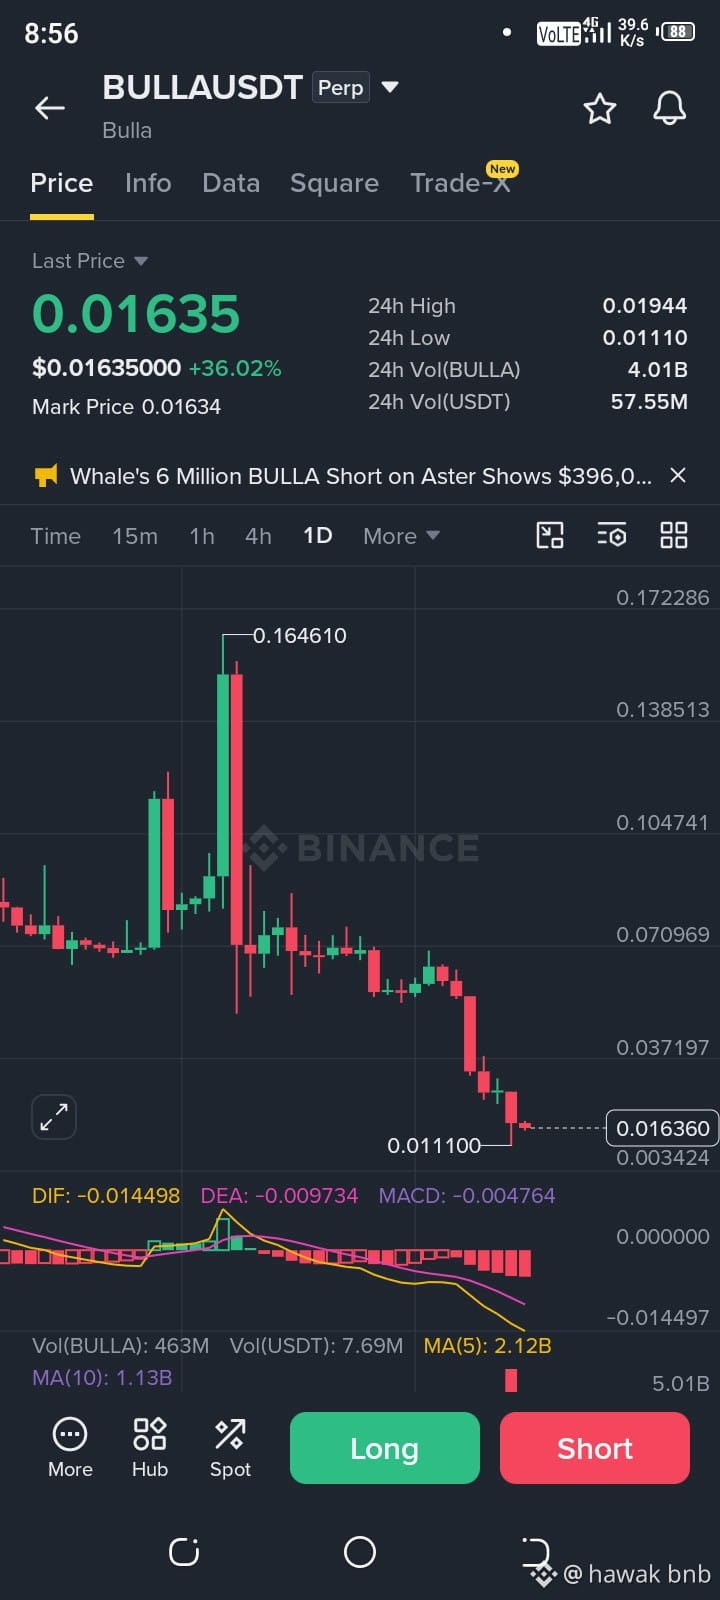
The 1-day (1D) chart for BULLA/USDT Perpetual on Binance displays a pronounced downward macro trend accompanied by a sharp, localized relief rally. Currently trading at $0.01635, the asset shows a daily gain of +36.02%, driven by short-term buying pressure after bouncing off a recent swing low.
Price Action & Trend Structure
The daily timeframe illustrates a heavy bearish structural breakdown following a previous high peak at $0.164610. Prices experienced an extended downward trajectory, forming consecutive lower lows before stabilizing at a 24-hour low of $0.01110. The current candle reflects a strong bounce from this floor, pushing prices up toward a 24-hour high of $0.01944 before a slight retracement to the current level. Despite this intraday recovery, the broader chart configuration remains heavily skewed toward a macro downtrend.
Volume & Liquidity
Market participation remains active, registering a 24-hour trading volume of 4.01B BULLA and 57.55M USDT. This influx of volume indicates aggressive speculative trading around the bottom range, potentially fueled by short liquidations or bargain-hunting by retail traders following a steep correction. @Bulla #Bullausdt $BULLA
#AnthropicIPOTestsInvestorAppetiteForAI #NvidiaBoardNotConsideringHuang’sReturnasCEO #WhatInvestmentSignalsDo13FFilingsReveal? #OPTIMJACKAttackInfectsAtLeast186Websites
The 1-day (1D) chart for BULLA/USDT Perpetual on Binance displays a pronounced downward macro trend accompanied by a sharp, localized relief rally. Currently trading at $0.01635, the asset shows a daily gain of +36.02%, driven by short-term buying pressure after bouncing off a recent swing low.
Price Action & Trend Structure
The daily timeframe illustrates a heavy bearish structural breakdown following a previous high peak at $0.164610. Prices experienced an extended downward trajectory, forming consecutive lower lows before stabilizing at a 24-hour low of $0.01110. The current candle reflects a strong bounce from this floor, pushing prices up toward a 24-hour high of $0.01944 before a slight retracement to the current level. Despite this intraday recovery, the broader chart configuration remains heavily skewed toward a macro downtrend.
Volume & Liquidity
Market participation remains active, registering a 24-hour trading volume of 4.01B BULLA and 57.55M USDT. This influx of volume indicates aggressive speculative trading around the bottom range, potentially fueled by short liquidations or bargain-hunting by retail traders following a steep correction. @Bulla #Bullausdt $BULLA
#AnthropicIPOTestsInvestorAppetiteForAI #NvidiaBoardNotConsideringHuang’sReturnasCEO #WhatInvestmentSignalsDo13FFilingsReveal? #OPTIMJACKAttackInfectsAtLeast186Websites