
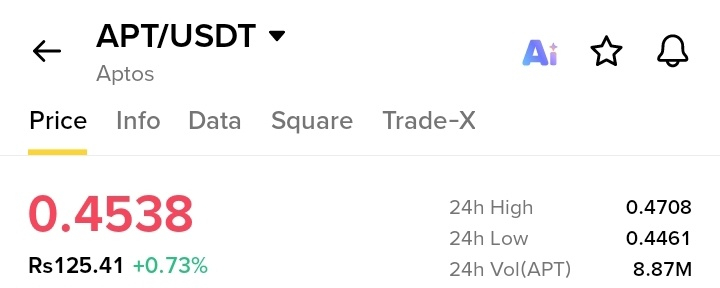

APT/USDT (15-Minute Timeframe)
Current Price: $0.4538
Market Bias: Short-Term Neutral-to-Bearish / Consolidation Near Support
📊 Market Overview & Technical Context
Price Action: After rejection near the local high of $0.4708, APT has experienced a retracement, currently trading below its short-term moving averages (MA(7) at $0.4603, EMA(20) at $0.4582, and EMA(50) at $0.4576).
Support & Resistance:
Immediate Support: Holding closely above the swing low zone near $0.4519. A break below this level could invite further downside toward lower liquidity pools.
Immediate Resistance: Clustered around the $0.4580 – $0.4600 moving average band, with major overhead resistance standing firm at $0.4708.
Momentum Indicators:
RSI(6) sits at 36.44 and RSI(14) at 43.85, indicating subdued bearish momentum and approaching oversold territory, which leaves room for a potential short-term relief bounce if support holds.
🎯 Tactical Setup (Intraday Scalp / Short-Term)
Potential Long Setup (Mean Reversion / Bounce):
Entry Zone: Near support retest ($0.4520 – $0.4540)
Stop Loss (Invalidation): Below $0.4490 (to filter out wick sweeps)
Take Profit Targets:
Target 1: $0.4580 (EMA(20) resistance)
Target 2: $0.4650 (Mid-range liquidity zone)
#A Packed Week of Earnings and Data Tests Markets #AnthropicIPOTestsInvestorAppetiteForAI #BitcoinExtendsLosingStreakToSixWeeks #HuangReportedlyConsidersReturnToNvidia #XRPFallsTo$0.89LowestSinceNovember2024