$BTC /USDT - Market Analysis Current Price:
$65,140 Market Structure: Bearish Bitcoin is trading below all major moving averages:
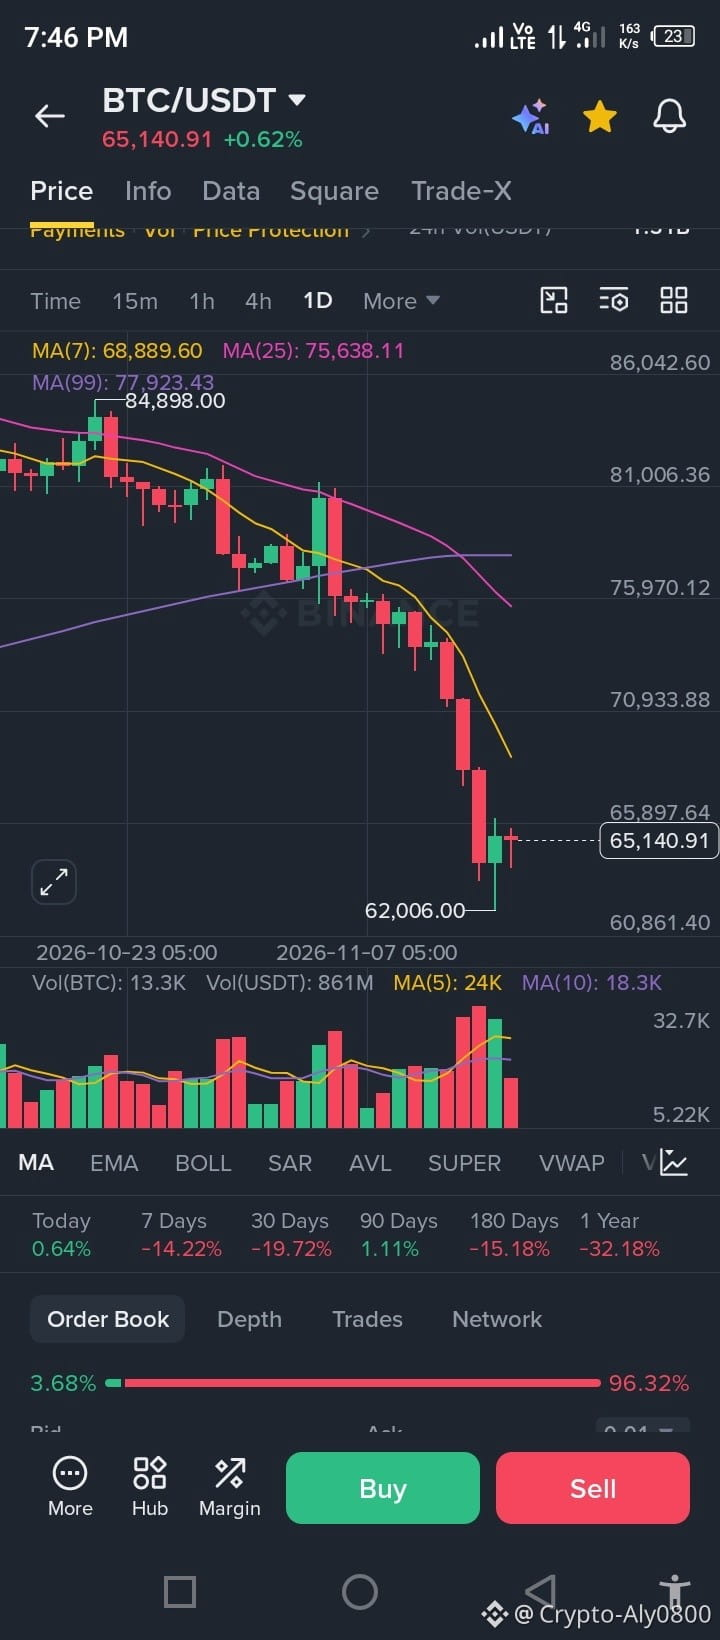
MA (7): $68,889 MA (25): $75,638 MA (99): $77,923 This indicates that sellers remain in control, with strong selling pressure on any upward movements.
Performance: Today: +0.64% 7 Days: -14.22% 30 Days: -19.72% 180 Days: -15.18% 1 Year: -32.18% Bitcoin has experienced its sixth consecutive weekly loss, with a total correction exceeding 24% from recent highs. Key Levels to Watch:
Resistance: $68,889 - First Major Resistance (MA 7) $75,638 - Second Major Resistance (MA 25) Support: $62,006 - Most Important Support (Last Week Low) $60,000 - Psychological Support Reason for Decline: Spot Bitcoin ETFs reported over $1.07 billion in outflows last week, marking the second consecutive week of billion-dollar outflows.
Institutional selling is a significant factor in this decline. Technical View: The Daily RSI is approximately 23, indicating an oversold condition.
A short-term bounce may occur, but the overall trend remains bearish until the price closes above $68,889 on a daily basis.
Outlook: Bearish below $68,889 Scenario
1 - Bullish Bounce: If $62,006 holds, $BTC may bounce towards $68,889. Scenario
2 - Bearish Breakdown: If $62,006 breaks, the next target is $60,000. It is advisable to wait for confirmation before making decisions. Risk management is crucial.
What are your thoughts? Will $62,000 hold or break? Comment: Bullish or Bearish.
#BTC☀ #BTCANALYSIS📊 #BİNANCESQUARE
$65,140 Market Structure: Bearish Bitcoin is trading below all major moving averages:
MA (7): $68,889 MA (25): $75,638 MA (99): $77,923 This indicates that sellers remain in control, with strong selling pressure on any upward movements.
Performance: Today: +0.64% 7 Days: -14.22% 30 Days: -19.72% 180 Days: -15.18% 1 Year: -32.18% Bitcoin has experienced its sixth consecutive weekly loss, with a total correction exceeding 24% from recent highs. Key Levels to Watch:
Resistance: $68,889 - First Major Resistance (MA 7) $75,638 - Second Major Resistance (MA 25) Support: $62,006 - Most Important Support (Last Week Low) $60,000 - Psychological Support Reason for Decline: Spot Bitcoin ETFs reported over $1.07 billion in outflows last week, marking the second consecutive week of billion-dollar outflows.
Institutional selling is a significant factor in this decline. Technical View: The Daily RSI is approximately 23, indicating an oversold condition.
A short-term bounce may occur, but the overall trend remains bearish until the price closes above $68,889 on a daily basis.
Outlook: Bearish below $68,889 Scenario
1 - Bullish Bounce: If $62,006 holds, $BTC may bounce towards $68,889. Scenario
2 - Bearish Breakdown: If $62,006 breaks, the next target is $60,000. It is advisable to wait for confirmation before making decisions. Risk management is crucial.
What are your thoughts? Will $62,000 hold or break? Comment: Bullish or Bearish.
#BTC☀ #BTCANALYSIS📊 #BİNANCESQUARE