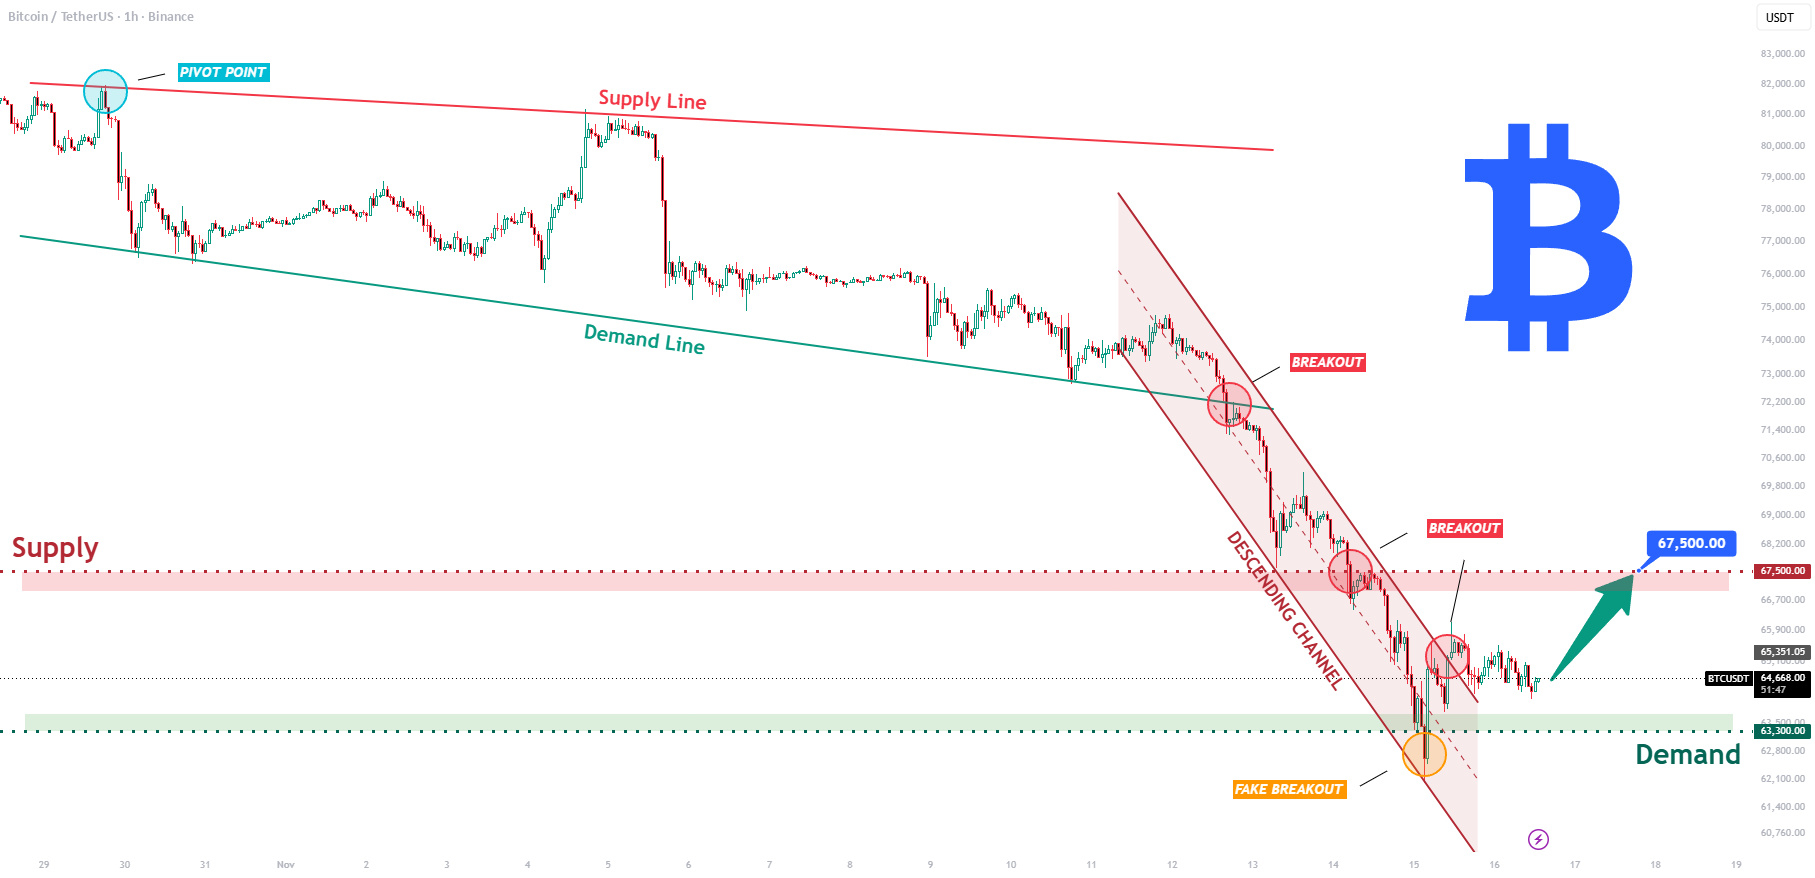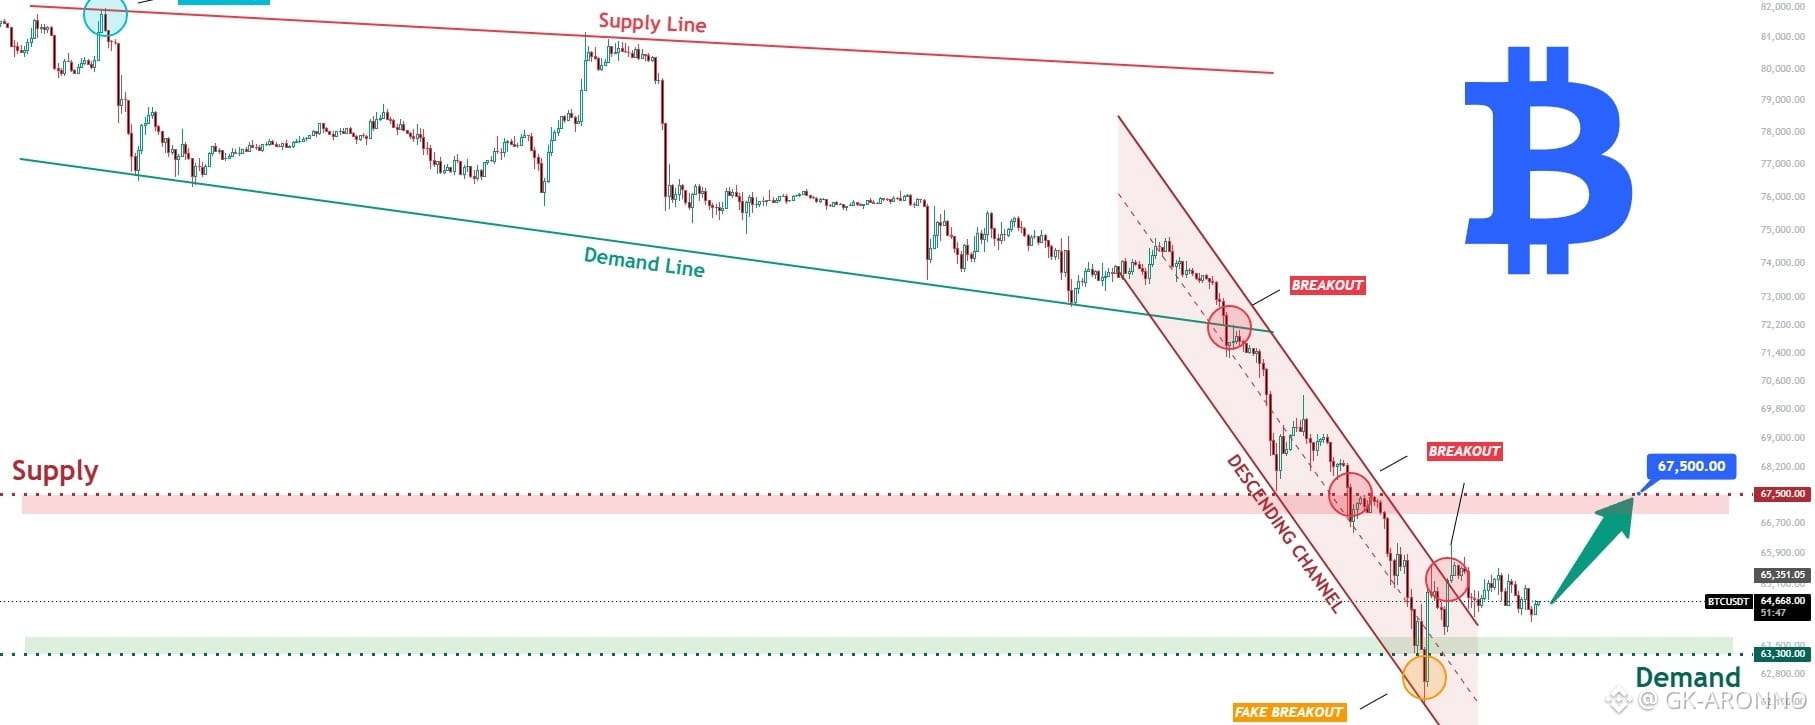


Hello traders! Here’s my technical outlook based on the current BTCUSDT (1H) chart structure. BTCUSDT previously declined inside a descending channel and tested the Demand Zone near 63,300 with a fake breakout. Price then bounced, showing signs of buyers defending support.
Currently, BTCUSDT is trading below the 67,500 Supply Zone while holding above the 63,300 Demand Zone. The recent bounce from support suggests buyers are preparing for another move higher.
As long as BTCUSDT remains above 63,300 and respects the Demand Zone, the bullish scenario remains valid. A continuation higher could target 67,500 (TP1). However, a break below 63,300 would weaken the bullish outlook and open the door for further downside. Manage your risk!

BTCUSDT
無期限
64,637.2
-1.01%