Headline: 🚨 $BTC/USDT Technical Setup: Oversold Bounce or Further Breakdown? Key Levels to Watch! 📉📈
Bitcoin ($BTC ) has faced heavy selling pressure, dropping toward the $64,900 – $65,300 region after losing the $68,000 support level. While higher-timeframe moving averages remain bearish, short-term momentum indicators (RSI dipping below 30) show extreme oversold conditions—setting up a high-probability relief bounce from major support.
Here is the clean intraday/swing setup for $BTC/USDT:
🟢 Trade Direction: LONG (Counter-Trend Relief Bounce)
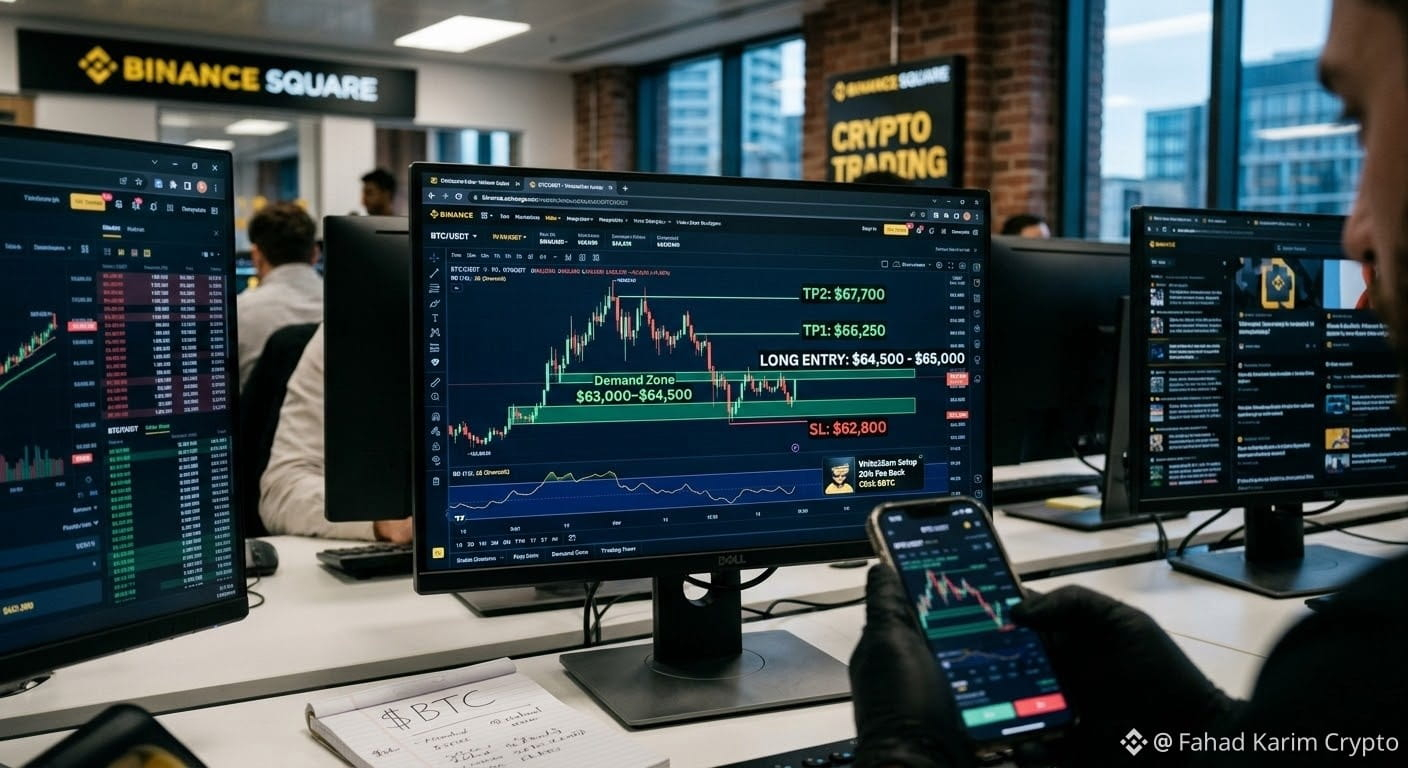
Entry Zone: $64,500 – $65,000 (Wait for 1H/4H bullish candle confirmation near the $63,000–$64,500 demand zone)
Take Profit 1 (TP1): $66,250 (Immediate local resistance)
Take Profit 2 (TP2): $67,700 (50-Day Moving Average retest)
Take Profit 3 (TP3): $69,500 (Psychological breakdown level)
Stop Loss (SL): $62,800 (Just below the key $63,000 structural support—a clean break below invalidates the bounce and opens $60,000)
⚖️ Risk Management:
Risk-to-Reward Ratio: ~1 : 2.1 (targeting TP2)
Leverage: Keep isolated leverage conservative (5x–10x max) due to elevated volatility. Always move SL to breakeven once TP1 hits.
💡 Alternative Bearish Scenario: If $BTC fails to hold $63,000 on a 4H candle close, avoid longs and look for breakdown shorts targeting $60,000.
What’s your move on $BTC today—buying the oversold dip or waiting for $60K? Drop your thoughts below! 👇
#BTC #Bitcoin #CryptoTrading #TechnicalAnalysis #Write2Earn $BTC
Bitcoin ($BTC ) has faced heavy selling pressure, dropping toward the $64,900 – $65,300 region after losing the $68,000 support level. While higher-timeframe moving averages remain bearish, short-term momentum indicators (RSI dipping below 30) show extreme oversold conditions—setting up a high-probability relief bounce from major support.
Here is the clean intraday/swing setup for $BTC/USDT:
🟢 Trade Direction: LONG (Counter-Trend Relief Bounce)
Entry Zone: $64,500 – $65,000 (Wait for 1H/4H bullish candle confirmation near the $63,000–$64,500 demand zone)
Take Profit 1 (TP1): $66,250 (Immediate local resistance)
Take Profit 2 (TP2): $67,700 (50-Day Moving Average retest)
Take Profit 3 (TP3): $69,500 (Psychological breakdown level)
Stop Loss (SL): $62,800 (Just below the key $63,000 structural support—a clean break below invalidates the bounce and opens $60,000)
⚖️ Risk Management:
Risk-to-Reward Ratio: ~1 : 2.1 (targeting TP2)
Leverage: Keep isolated leverage conservative (5x–10x max) due to elevated volatility. Always move SL to breakeven once TP1 hits.
💡 Alternative Bearish Scenario: If $BTC fails to hold $63,000 on a 4H candle close, avoid longs and look for breakdown shorts targeting $60,000.
What’s your move on $BTC today—buying the oversold dip or waiting for $60K? Drop your thoughts below! 👇
#BTC #Bitcoin #CryptoTrading #TechnicalAnalysis #Write2Earn $BTC