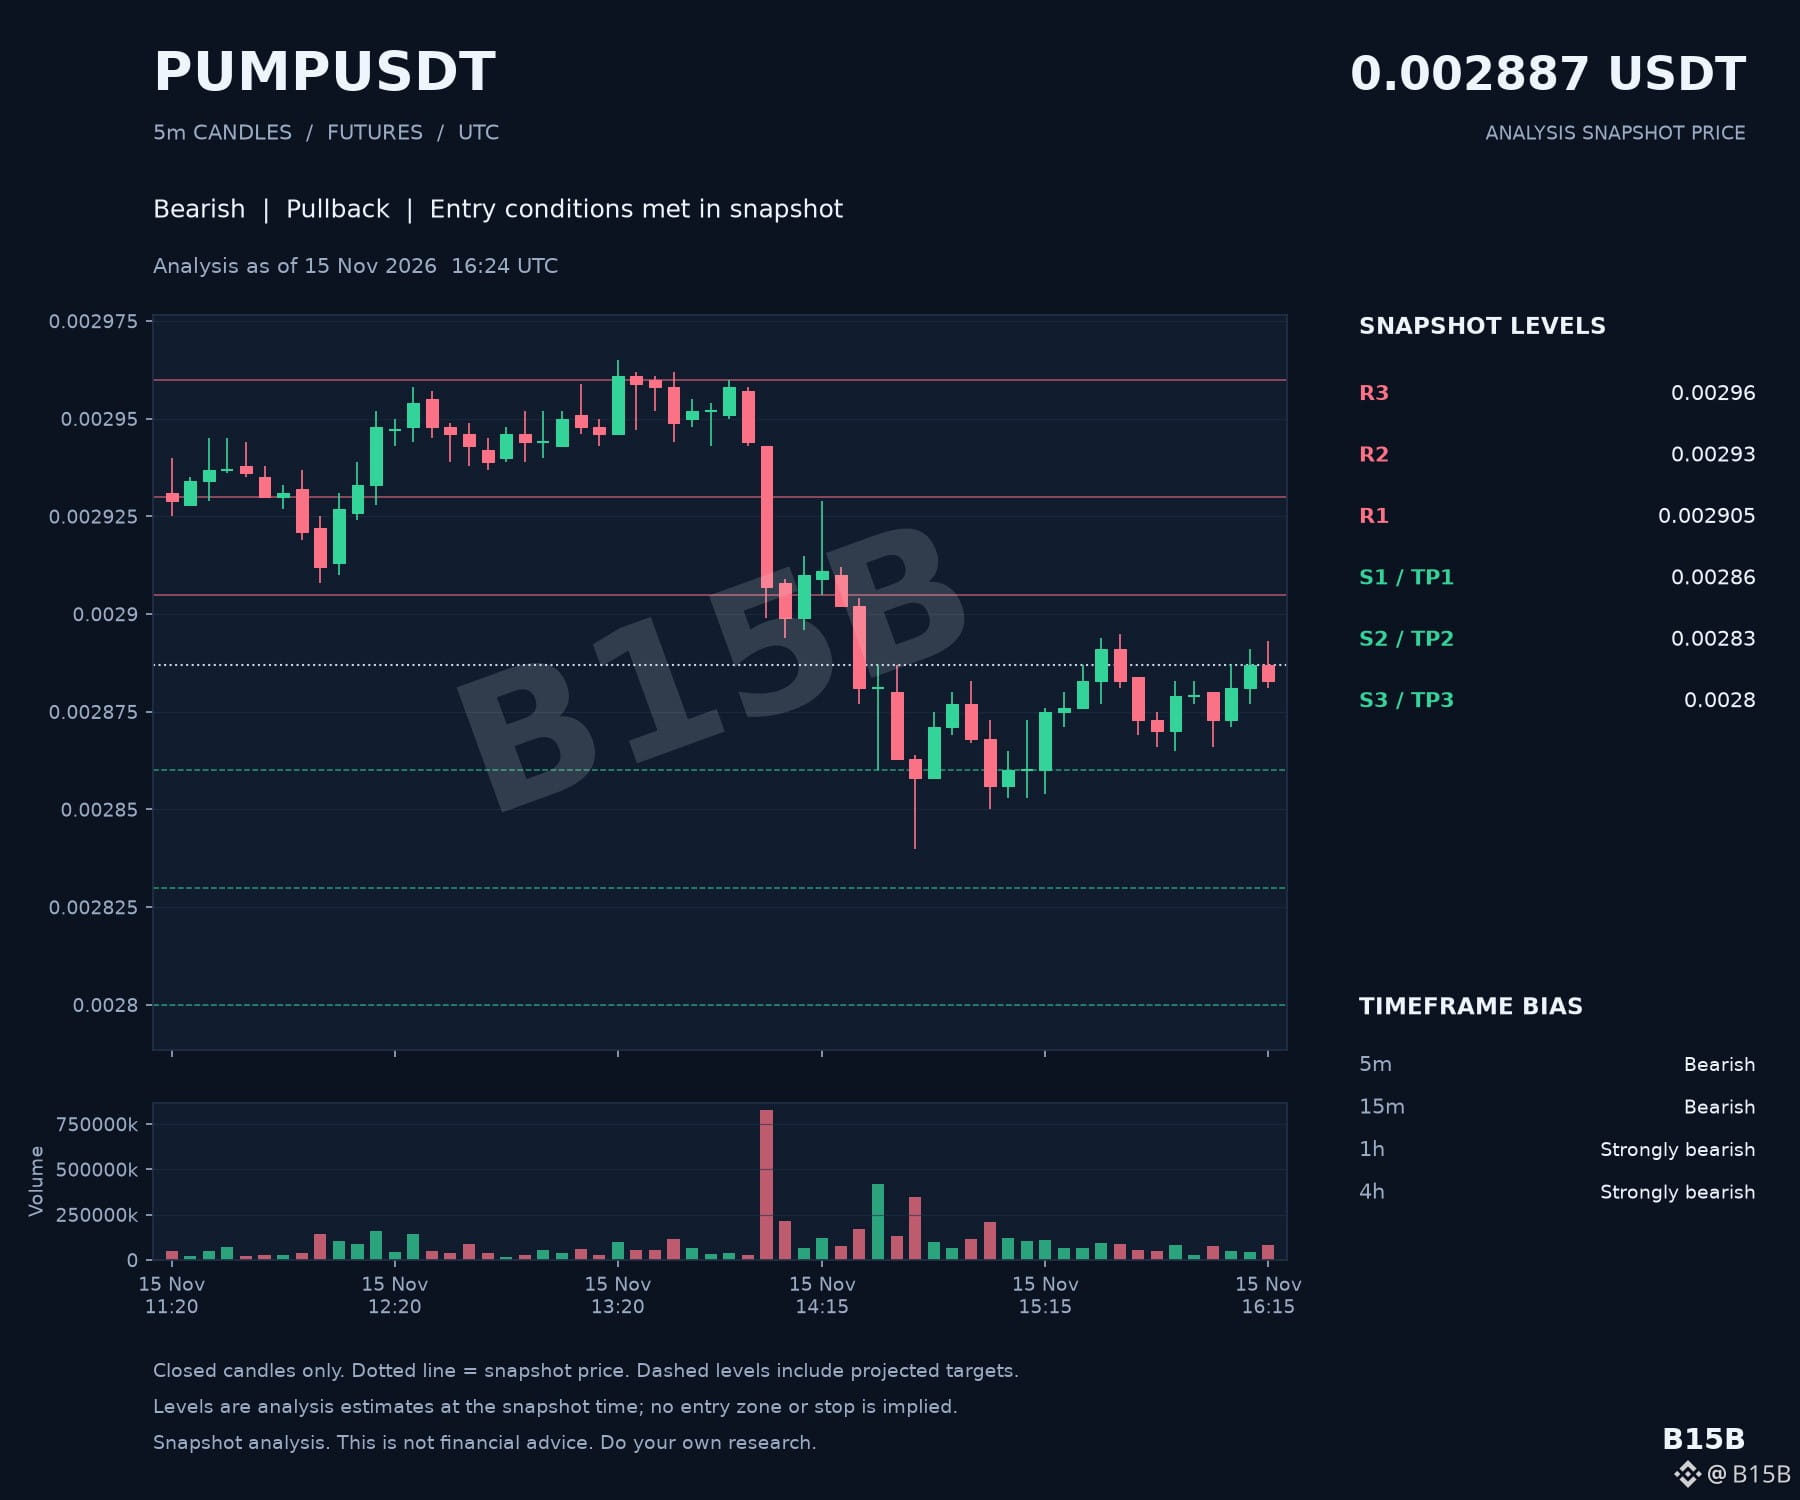
$PUMP is currently navigating a very heavy technical landscape. Despite the ticker, the price action is showing a unified front of bearish sentiment that stretches from the micro 5-minute chart all the way up to the 4-hour trend.
The market is currently in a pullback phase, and while internal entry conditions for this setup have been met, we haven't seen a confirmed execution. The trend strength is particularly notable; seeing the 1-hour and 4-hour timeframes both locked into "Strongly Bearish" status suggests that any upward bounces are facing significant structural resistance.
Key levels to watch as this structure develops:
- 🚧 Resistance: 0.002905 and 0.00293
- 🛡️ Support: 0.00286 and 0.00283
- 📉 Trend: Strongly Bearish (1h/4h)
- 🎯 Downside Scenarios: 0.00286, 0.00283, 0.0028
When you see a chart where every single timeframe from 5m to 4h is aligned in a bearish direction, what specific shift in price action at the 0.00286 support would you need to see to suggest the immediate selling pressure is finally exhausting?
With the price currently sitting at 0.002887, it is wedged tightly between the immediate 0.002905 resistance ceiling and the 0.00286 floor. ⚠️
#PUMP #CryptoAnalysis #TechnicalAnalysis #TradingView
The market is currently in a pullback phase, and while internal entry conditions for this setup have been met, we haven't seen a confirmed execution. The trend strength is particularly notable; seeing the 1-hour and 4-hour timeframes both locked into "Strongly Bearish" status suggests that any upward bounces are facing significant structural resistance.
Key levels to watch as this structure develops:
- 🚧 Resistance: 0.002905 and 0.00293
- 🛡️ Support: 0.00286 and 0.00283
- 📉 Trend: Strongly Bearish (1h/4h)
- 🎯 Downside Scenarios: 0.00286, 0.00283, 0.0028
When you see a chart where every single timeframe from 5m to 4h is aligned in a bearish direction, what specific shift in price action at the 0.00286 support would you need to see to suggest the immediate selling pressure is finally exhausting?
With the price currently sitting at 0.002887, it is wedged tightly between the immediate 0.002905 resistance ceiling and the 0.00286 floor. ⚠️
#PUMP #CryptoAnalysis #TechnicalAnalysis #TradingView