$SOPH: How Transparent Methodology Turns Readers Into Better Analysts
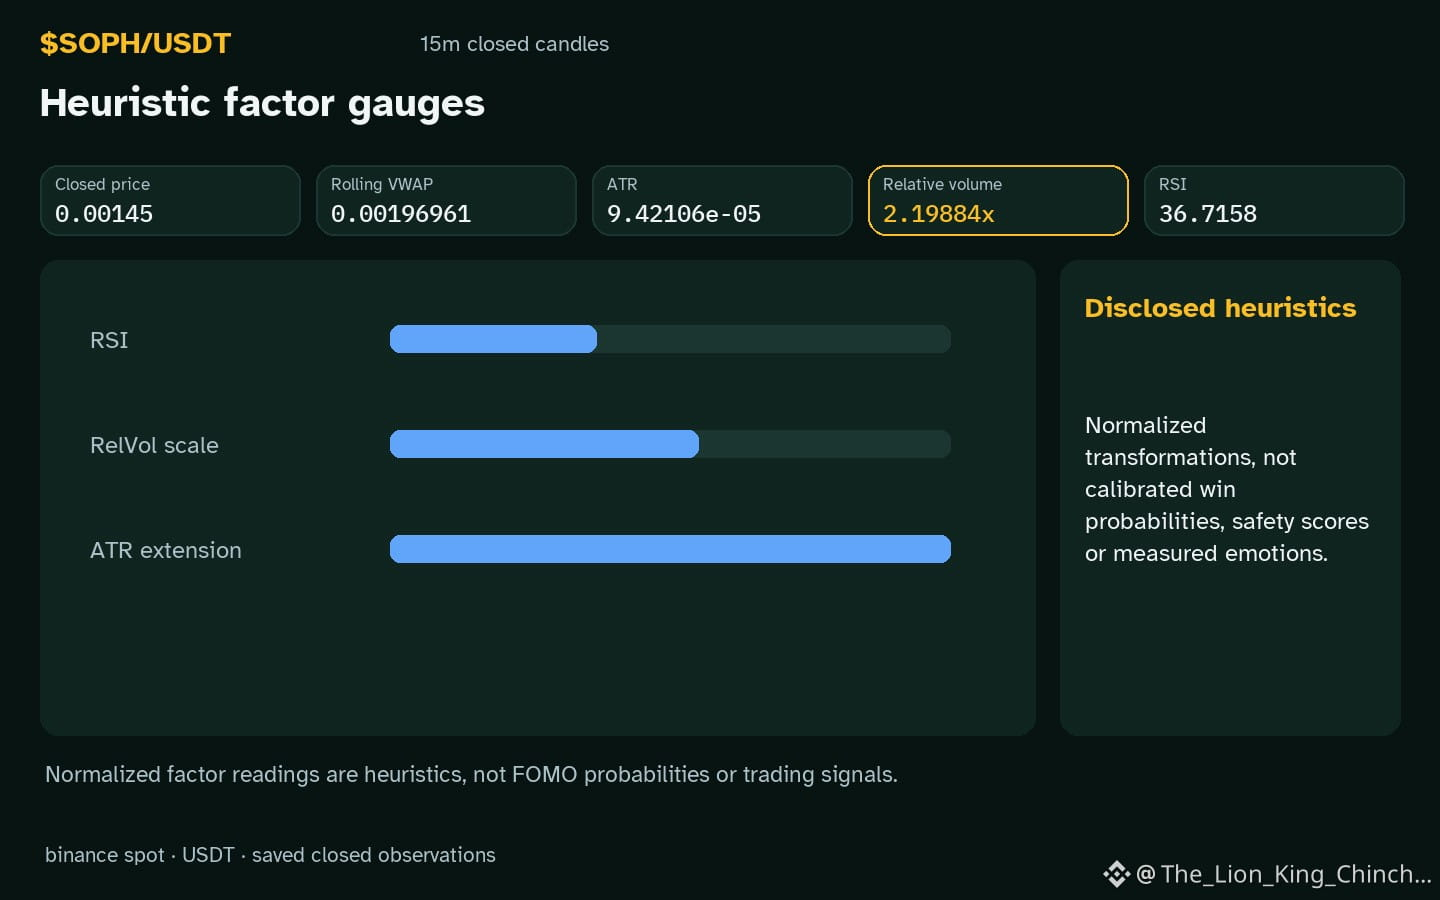
$SOPH: SOPH shows an hourly up direction while volume sits above baseline, prompting a natural question: how should a reader move from raw numbers to a justified interpretation? The dilemma is not about the price itself but about the cognitive step that turns an observation into a claim.\n\nOne useful mechanism is a self‑check rule: after noting the upward direction, ask whether the volume increase – expressed as 2.20x baseline – is sufficient on its own to support a bullish inference. A simple test is to compare this signal against a second, independent metric such as RSI 36.7. If RSI is also in a neutral or slightly overbought zone, the combined evidence may suggest momentum, but it does not prove that larger market participants are buying.\n\nA counterexample helps illustrate limits. Suppose the next closed hourly candle shows a flat price despite the same volume level; the earlier inference weakens because price did not respond as expected. This scenario teaches readers to treat each metric as a conditional piece, not as a definitive trigger.\n\nThe broader lesson is to separate observation – the chart data – from persuasion – the story we build around it. By habitually asking what future evidence could contradict the current reading, analysts create a feedback loop that guards against overconfidence and social proof bias.
Probabilistic market research, not a recommendation or guaranteed return.
#SOPH #CryptoCommunity #CryptoLearning
$SOPH: SOPH shows an hourly up direction while volume sits above baseline, prompting a natural question: how should a reader move from raw numbers to a justified interpretation? The dilemma is not about the price itself but about the cognitive step that turns an observation into a claim.\n\nOne useful mechanism is a self‑check rule: after noting the upward direction, ask whether the volume increase – expressed as 2.20x baseline – is sufficient on its own to support a bullish inference. A simple test is to compare this signal against a second, independent metric such as RSI 36.7. If RSI is also in a neutral or slightly overbought zone, the combined evidence may suggest momentum, but it does not prove that larger market participants are buying.\n\nA counterexample helps illustrate limits. Suppose the next closed hourly candle shows a flat price despite the same volume level; the earlier inference weakens because price did not respond as expected. This scenario teaches readers to treat each metric as a conditional piece, not as a definitive trigger.\n\nThe broader lesson is to separate observation – the chart data – from persuasion – the story we build around it. By habitually asking what future evidence could contradict the current reading, analysts create a feedback loop that guards against overconfidence and social proof bias.
Probabilistic market research, not a recommendation or guaranteed return.
#SOPH #CryptoCommunity #CryptoLearning