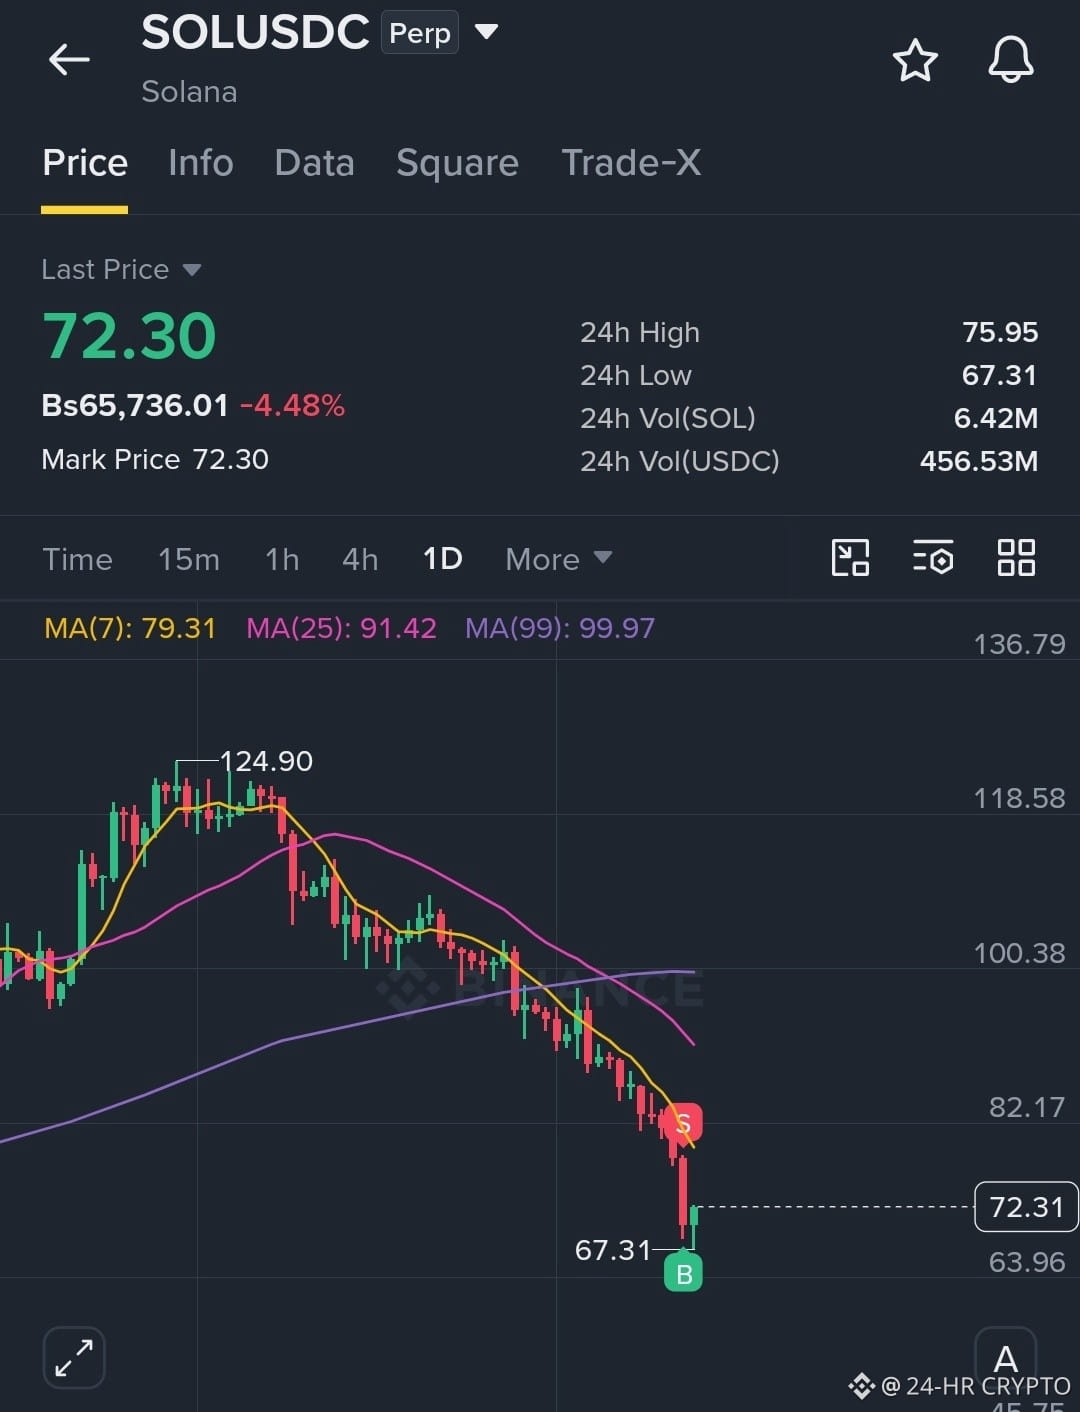
The provided $SOL USDC perpetual trading chart on the 1D timeframe shows Solana priced at 72.30, reflecting a 4.48% decrease. Over the past 24 hours, the price fluctuated between a high of 75.95 and a low of 67.31...
The chart displays a significant downward trend from a peak of 124.90, with moving averages MA(7) at 79.31, MA(25) at 91.42, and MA(99) at 99.97. #DYOR🟢
$EVAA Top Gainers 💥🐋
$BTW Sellers took control Onging profit...
The chart displays a significant downward trend from a peak of 124.90, with moving averages MA(7) at 79.31, MA(25) at 91.42, and MA(99) at 99.97. #DYOR🟢
$EVAA Top Gainers 💥🐋
$BTW Sellers took control Onging profit...