🚀 AFTER THAT BRUTAL DUMP, IS $SOXS PREPARING FOR ITS NEXT BIG PUMP?
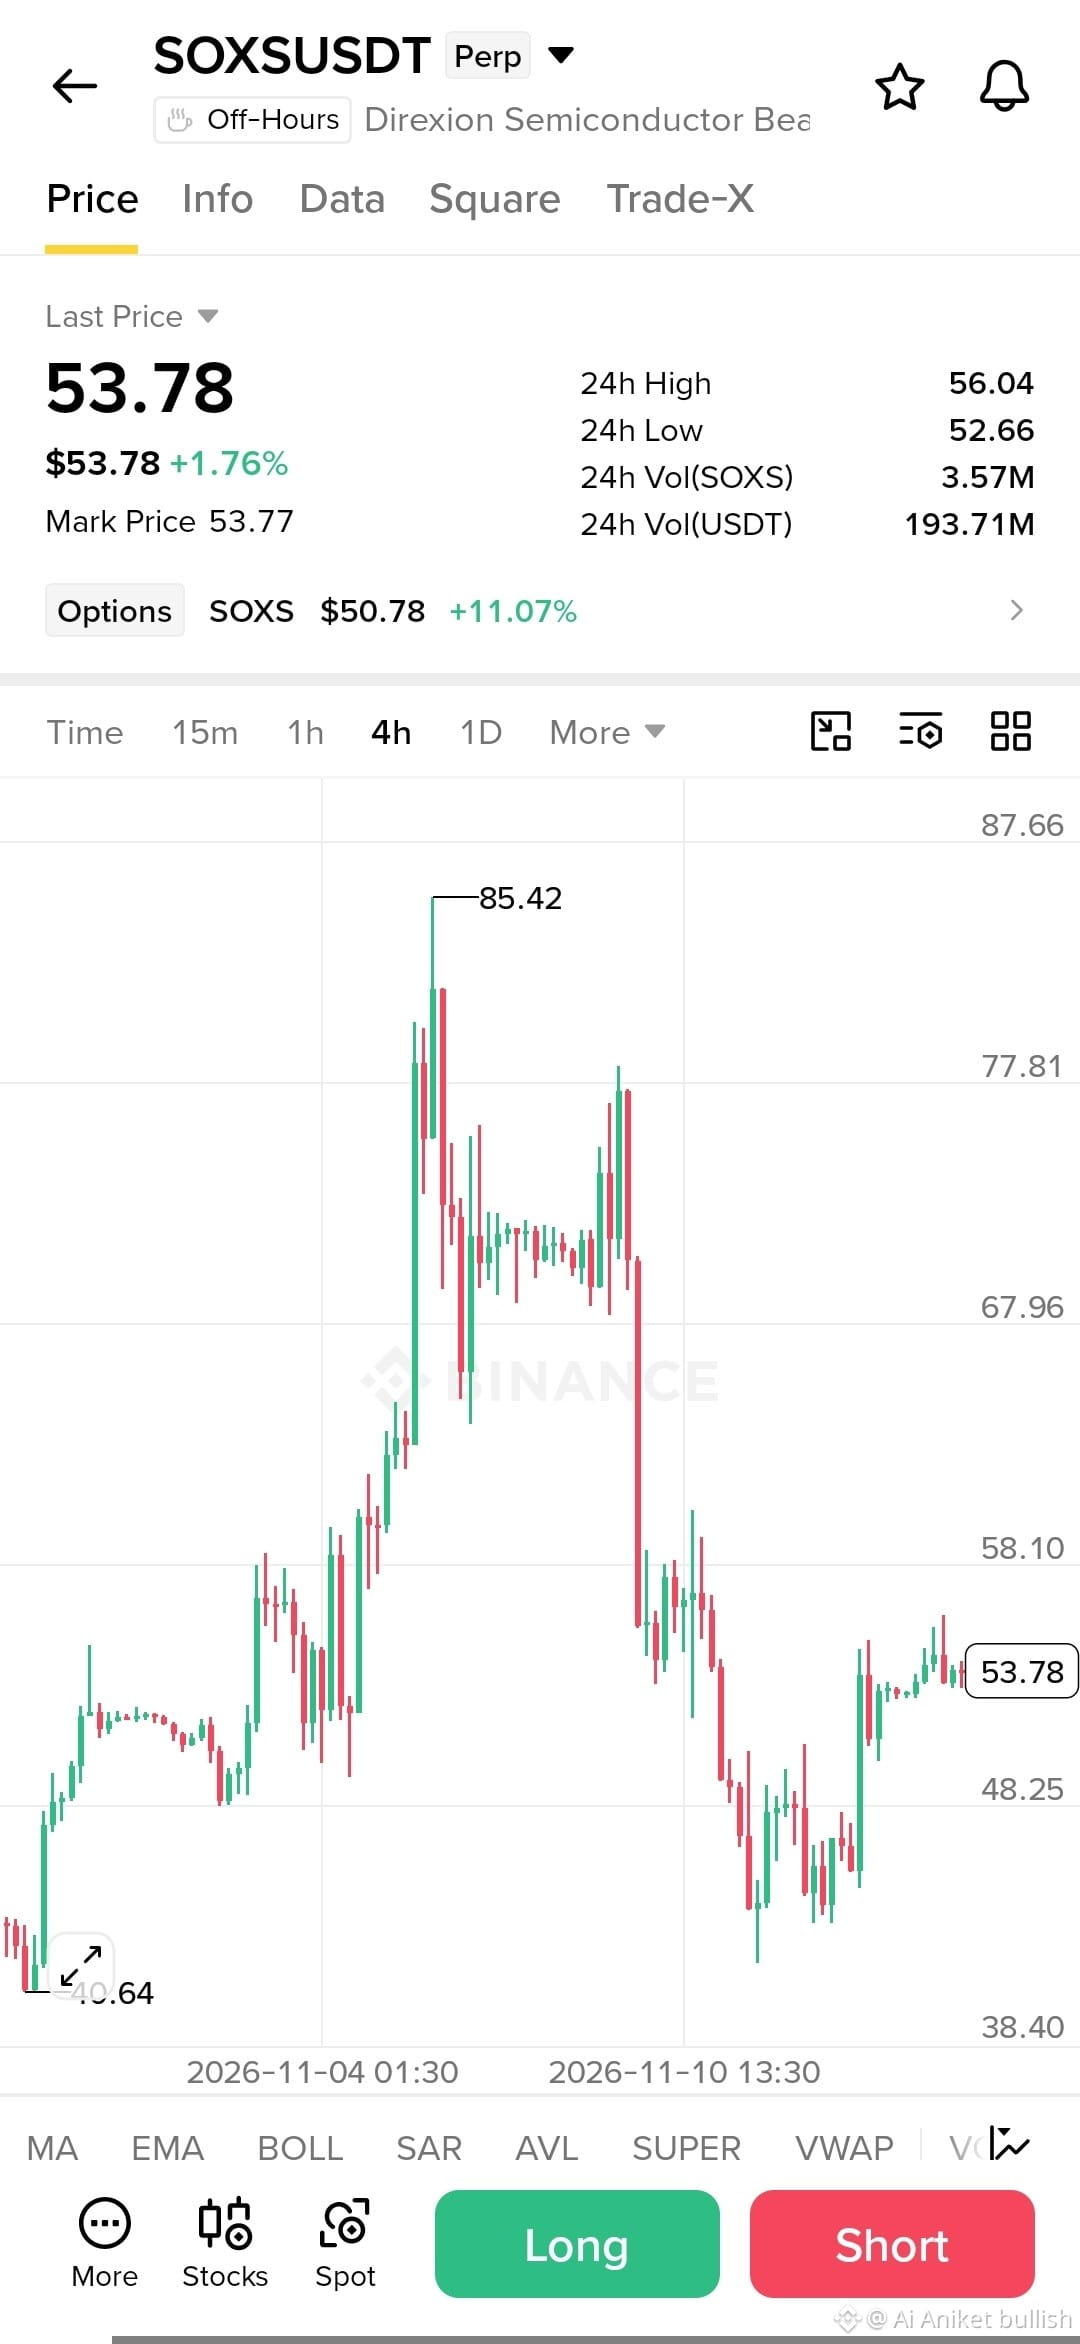
$SOXS is showing signs of recovery after falling sharply from the $85.42 high. The 4H chart now shows a bounce from the $40–42 area, with price trading near $53.78.
I'm watching a potential LONG opportunity. Here's what caught my attention:
📈 Buyers pushed price back above the $48 area. 📈 Price is holding near $53 after the recovery. 📈 A breakout above $56 could open the way toward the $58 zone.
Key levels to watch:
Resistance: $56.04
Next upside area: $58.10
Support: $52.66
Lower support: $48.25
My bias is LONG while the recovery structure holds. A rejection near $56 could change the picture.
Is this the start of another SOXS rally, or just a temporary bounce?
#SOXS #semiconductor #trading
$SOXS is showing signs of recovery after falling sharply from the $85.42 high. The 4H chart now shows a bounce from the $40–42 area, with price trading near $53.78.
I'm watching a potential LONG opportunity. Here's what caught my attention:
📈 Buyers pushed price back above the $48 area. 📈 Price is holding near $53 after the recovery. 📈 A breakout above $56 could open the way toward the $58 zone.
Key levels to watch:
Resistance: $56.04
Next upside area: $58.10
Support: $52.66
Lower support: $48.25
My bias is LONG while the recovery structure holds. A rejection near $56 could change the picture.
Is this the start of another SOXS rally, or just a temporary bounce?
#SOXS #semiconductor #trading