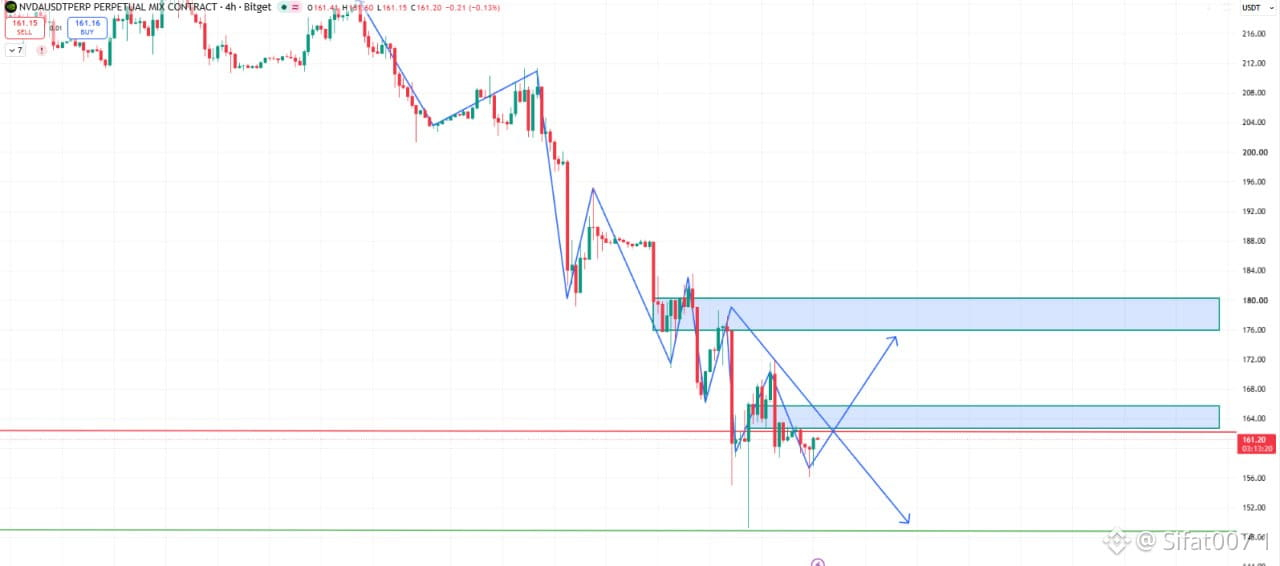
$NVDA is approaching another important decision point on the 4-hour chart. The latest chart shows NVDA trading around $161-162, just below the marked $163–$166 resistance zone.
However, I wouldn't completely dismiss the bullish possibility. Price has reacted around the $156–$158 area, and the latest candles suggest that buyers are still trying to stabilize the market.
For now, I see two possible paths:
• Bullish: The bullish case starts with price stabilizing around $156–$158 and reclaiming the $163–$166 zone. I would like to see buyers produce a strong 4H candle above $166, followed by a retest that holds as support. That would be the first meaningful sign that the recent selling pressure is easing.
• Bearish: The bearish case remains valid while price trades below $163–$166. If buyers attempt to reclaim that zone but fail, sellers could use the rejection to push price back toward $158. If $149 fails with strong selling pressure, the market could enter another leg lower. I would reassess the chart rather than assume that support will hold simply because it is marked.
✅Long Setup:
• Entry: 156–159 after bullish rejection
• SL: 153
• TP: 163/166/176
✅Short Setup:
• Entry: 163–166 after bearish rejection
• SL: 169
• TP: 158/156
The long-term AI story is still interesting, but the technical structure hasn't recovered yet. Until buyers reclaim $166, I would treat this as a market where selling pressure still deserves respect.
However, I wouldn't completely dismiss the bullish possibility. Price has reacted around the $156–$158 area, and the latest candles suggest that buyers are still trying to stabilize the market.
For now, I see two possible paths:
• Bullish: The bullish case starts with price stabilizing around $156–$158 and reclaiming the $163–$166 zone. I would like to see buyers produce a strong 4H candle above $166, followed by a retest that holds as support. That would be the first meaningful sign that the recent selling pressure is easing.
• Bearish: The bearish case remains valid while price trades below $163–$166. If buyers attempt to reclaim that zone but fail, sellers could use the rejection to push price back toward $158. If $149 fails with strong selling pressure, the market could enter another leg lower. I would reassess the chart rather than assume that support will hold simply because it is marked.
✅Long Setup:
• Entry: 156–159 after bullish rejection
• SL: 153
• TP: 163/166/176
✅Short Setup:
• Entry: 163–166 after bearish rejection
• SL: 169
• TP: 158/156
The long-term AI story is still interesting, but the technical structure hasn't recovered yet. Until buyers reclaim $166, I would treat this as a market where selling pressure still deserves respect.