


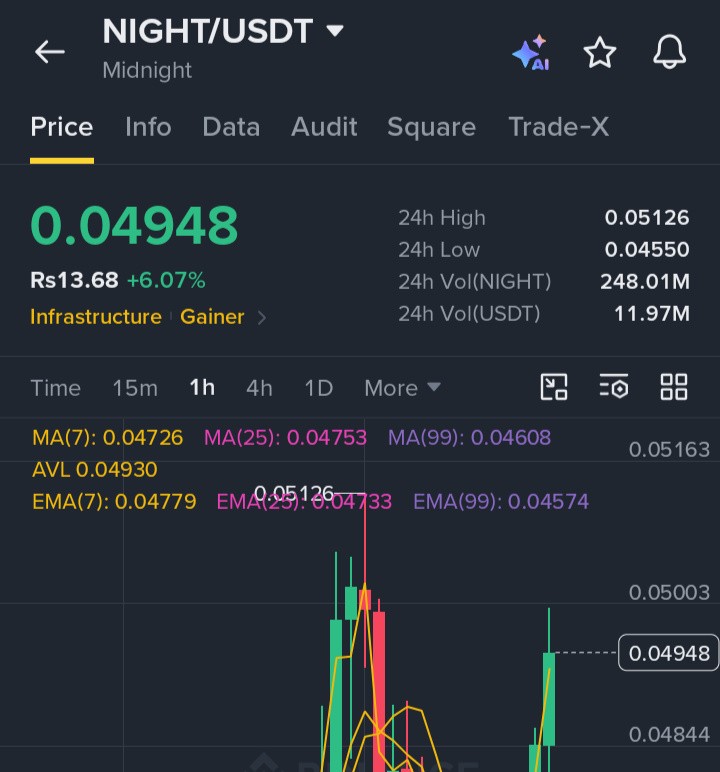
NIGHT is showing encouraging bullish momentum, with price currently trading around 0.04948, up approximately 6.07%. However, the important question is whether this recovery can develop into a sustained bullish continuation or whether sellers will step in near the previous supply area.

I am watching the reaction around the 0.05000–0.05126 region particularly closely.
Market Structure & Key Levels
On the available 1H chart, NIGHT has demonstrated a notable recovery from its recent trading range. Buyers have managed to push price back above the short-term moving averages, suggesting improving momentum.
The current price is trading above:
- MA(7): 0.04726
- MA(25): 0.04753
- MA(99): 0.04608
- EMA(7): 0.04779
- EMA(25): 0.04733
- EMA(99): 0.04574
This alignment is encouraging for short-term buyers, although it does not independently confirm a higher-timeframe trend reversal.
Important Resistance Zone
The immediate resistance area sits around 0.05000–0.05126.
This region deserves attention because price previously experienced rejection near 0.05126. A failure to overcome this area could invite another round of selling pressure.
For a convincing bullish continuation, I would prefer to see:
- A sustained 1H close above 0.05000.
- A successful breakout above 0.05126.
- A subsequent retest that holds the broken resistance as support.
Without these confirmations, chasing the current upward move carries additional risk.
Potential Pullback Opportunity
If price faces rejection near 0.05000–0.05126, I will monitor the 0.04844 area for a possible reaction.
Below that, the moving-average cluster around 0.04726–0.04779 becomes an important short-term reference area.
A controlled pullback followed by renewed buying pressure could provide stronger evidence that buyers are gaining control.
However, losing these areas decisively would weaken the immediate bullish structure.
Bullish & Bearish Scenarios
Bullish Scenario:
If NIGHT successfully reclaims 0.05000 and breaks 0.05126 with sustained buying pressure, the next visible chart reference is around 0.05163.
A confirmed breakout could open the door to further upside, but additional resistance levels cannot be established reliably from the available screenshot.
Bearish Scenario:
If buyers fail around 0.05000–0.05126 and price loses 0.04844, attention shifts toward the 0.04726–0.04779 moving-average cluster.
A sustained breakdown below that region would weaken the recovery and increase the possibility of a deeper retracement.
Consolidation Scenario:
Price may continue ranging between 0.04844 and 0.05000 while buyers and sellers compete for control. Such consolidation would not necessarily invalidate the recovery, but patience would be preferable until a decisive breakout occurs.
Risk Management & My Perspective
I am cautiously optimistic about NIGHT's short-term recovery, particularly because price is trading above its displayed moving averages.
However, I would not confuse improving 1H momentum with a confirmed broader trend reversal.
The available screenshot only shows the 1H timeframe. Daily and 4H charts are needed to establish major demand and supply zones, confirm the higher-timeframe structure, and identify more reliable invalidation levels.
For now, I would rather wait for a confirmed breakout or a well-structured pullback than chase an extended green candle.
The key question is: Can NIGHT break above 0.05126 and establish it as support, or will sellers use this resistance area to trigger another rejection?
I am interested in seeing how price reacts at this level before forming a stronger directional bias.