🚨 ETH UNDER PRESSURE: Massive Outflows and Extreme Oversold Levels — Are We Near the Bottom?
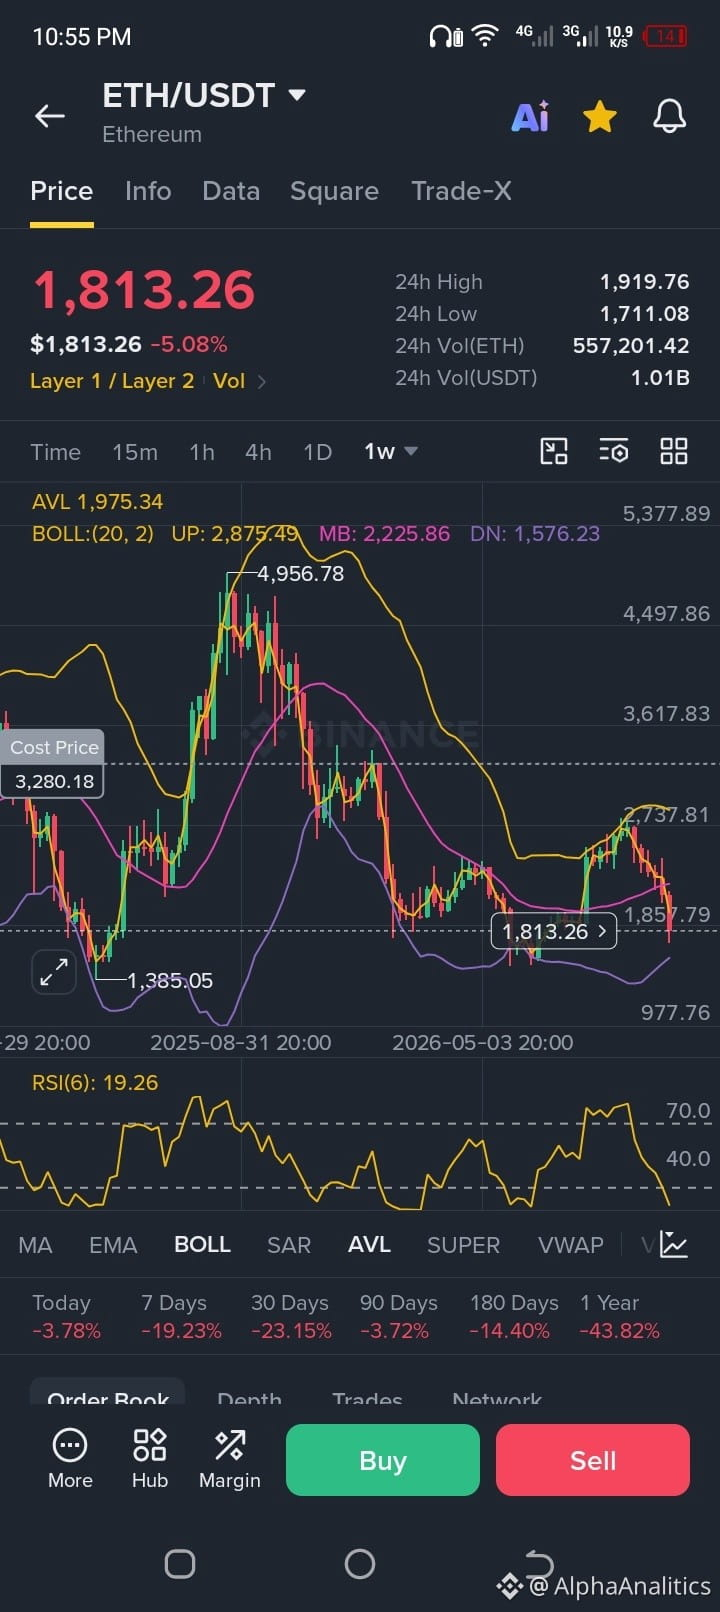
Ethereum ($ETH) is taking a heavy hit, trading down around $1,812 (-5.03%), reflecting a wave of intense market pressure. Looking under the hood at the latest Binance data and on-chain metrics reveals a fascinating story:
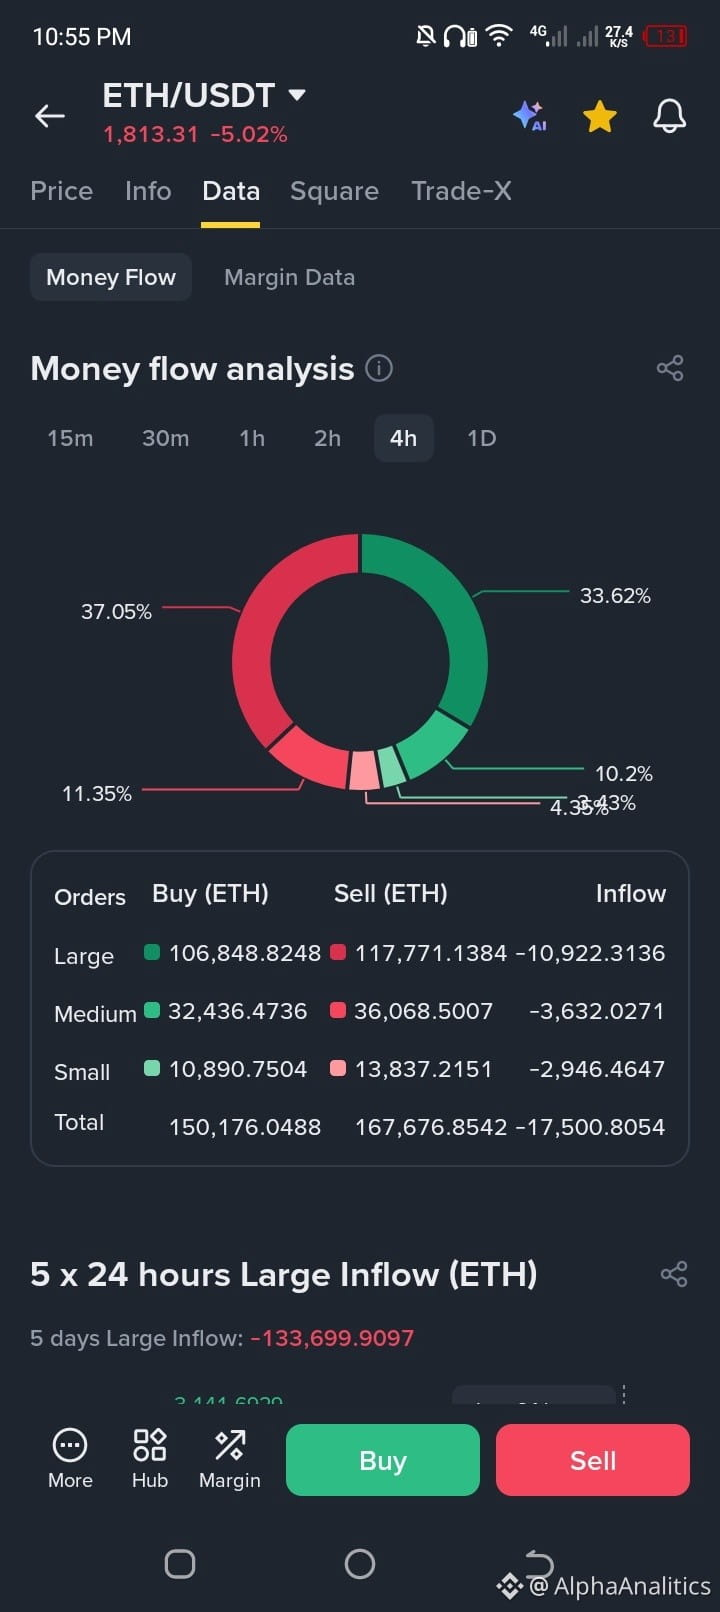
📉 Money Flow & Outflows: The 5-day large inflow shows a heavy negative balance of over -133,699 ETH, backed by massive net outflows in large orders over the last 24 hours. Panic selling is clearly active.
📊 Extreme Weekly RSI: On the 1-week chart, the RSI(6) has plunged to an ice-cold 19.26, entering deep oversold territory reminiscent of major macro bottoms.
⚖️ Margin & Sentiment: While margin long-short ratios have shifted, the sheer speed of the flush indicates a classic capitulation phase where weak hands are getting shaken out.
📍 Buy Zones & DCA Strategy:
Support & Re-accumulation Range: The lower Bollinger band and key historical structure point to a strong accumulation zone between $1,550 and $1,750, with absolute capitulation floors closer to the $1,385 major swing low if volatility expands.
Action Plan: Smart money doesn't catch falling knives all at once. Tiered scaling (DCA) within this lower band is where long-term players start building positions.
Are you accumulating ETH at these levels or waiting for further confirmation? Drop your strategy below! 👇
#Ethereum #ETH #CryptoTrading #BinanceSquare #TechnicalAnalysis #DCA
Ethereum ($ETH) is taking a heavy hit, trading down around $1,812 (-5.03%), reflecting a wave of intense market pressure. Looking under the hood at the latest Binance data and on-chain metrics reveals a fascinating story:
📉 Money Flow & Outflows: The 5-day large inflow shows a heavy negative balance of over -133,699 ETH, backed by massive net outflows in large orders over the last 24 hours. Panic selling is clearly active.
📊 Extreme Weekly RSI: On the 1-week chart, the RSI(6) has plunged to an ice-cold 19.26, entering deep oversold territory reminiscent of major macro bottoms.
⚖️ Margin & Sentiment: While margin long-short ratios have shifted, the sheer speed of the flush indicates a classic capitulation phase where weak hands are getting shaken out.
📍 Buy Zones & DCA Strategy:
Support & Re-accumulation Range: The lower Bollinger band and key historical structure point to a strong accumulation zone between $1,550 and $1,750, with absolute capitulation floors closer to the $1,385 major swing low if volatility expands.
Action Plan: Smart money doesn't catch falling knives all at once. Tiered scaling (DCA) within this lower band is where long-term players start building positions.
Are you accumulating ETH at these levels or waiting for further confirmation? Drop your strategy below! 👇
#Ethereum #ETH #CryptoTrading #BinanceSquare #TechnicalAnalysis #DCA