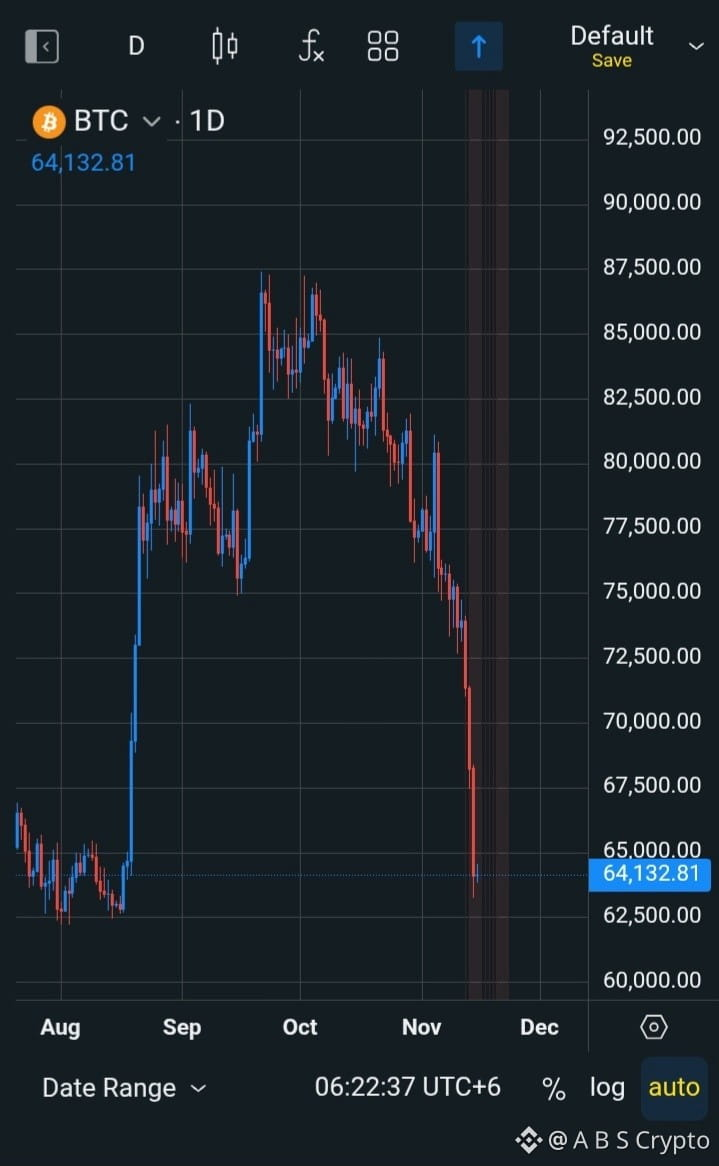
🔴 BTC Liquidity Map: Price at ~$64,130, Where Are the Stops Sitting?
Bitcoin has dropped almost straight down from ~$81,000 in early November and landed back in the August base zone. Here's where liquidity appears to be sitting on the daily chart:
🔻 Sell-side liquidity (below):
▫️ ~$62,500–$62,300: Multiple August lows formed here. Expect a pool of stop-losses resting beneath these equal lows.
▫️ $60,000: A psychological round number, likely packed with resting orders.
🔺 Buy-side liquidity (above):
▫️ $65,000: Previous support, now resistance.
▫️ $67,500–$72,500: Price fell through this zone so fast that almost no trading happened here, making it a large imbalance zone. A bounce could fill it.
▫️ ~$75,000: Stops resting under the September low.
▫️ ~$81,000 and ~$84,800: The November and October lower highs, with short stops stacked above.
▫️ ~$87,300: The biggest high of the range.
💡 What could play out:
A sweep below $62,500 followed by a quick recovery could signal a bounce.
A close below it would make $60,000 the next target.
If a bounce comes, the first target is $65,000, then the $67,500–$72,500 imbalance zone.
🗳️ What's your call?
1️⃣ Sweep $62,500 first
2️⃣ Straight bounce
3️⃣ Drop to $60,000
Let us know in the comments 👇
⚠️ Not financial advice. This is technical analysis only. Always do your own research.
#BTC #Bitcoin #Liquidity #CryptoAnalysis #BTCUSDT
Bitcoin has dropped almost straight down from ~$81,000 in early November and landed back in the August base zone. Here's where liquidity appears to be sitting on the daily chart:
🔻 Sell-side liquidity (below):
▫️ ~$62,500–$62,300: Multiple August lows formed here. Expect a pool of stop-losses resting beneath these equal lows.
▫️ $60,000: A psychological round number, likely packed with resting orders.
🔺 Buy-side liquidity (above):
▫️ $65,000: Previous support, now resistance.
▫️ $67,500–$72,500: Price fell through this zone so fast that almost no trading happened here, making it a large imbalance zone. A bounce could fill it.
▫️ ~$75,000: Stops resting under the September low.
▫️ ~$81,000 and ~$84,800: The November and October lower highs, with short stops stacked above.
▫️ ~$87,300: The biggest high of the range.
💡 What could play out:
A sweep below $62,500 followed by a quick recovery could signal a bounce.
A close below it would make $60,000 the next target.
If a bounce comes, the first target is $65,000, then the $67,500–$72,500 imbalance zone.
🗳️ What's your call?
1️⃣ Sweep $62,500 first
2️⃣ Straight bounce
3️⃣ Drop to $60,000
Let us know in the comments 👇
⚠️ Not financial advice. This is technical analysis only. Always do your own research.
#BTC #Bitcoin #Liquidity #CryptoAnalysis #BTCUSDT