



XRP has retraced most of its August recovery, with the $0.985 swing low becoming the next major support level.
XRP has been vulnerable to further declines after missing the Fibonacci support levels at $1.21, $1.10, and $1.04.
XRP's performance is underwhelming against Bitcoin, putting downside risks if the market as a whole takes the sell-off.
Despite losing multiple supports, XRP price action has become weak as traders are evaluating additional downside risks, with the August low now being priced above.
XRP Loses Ground After Failing to Hold Fibonacci Support
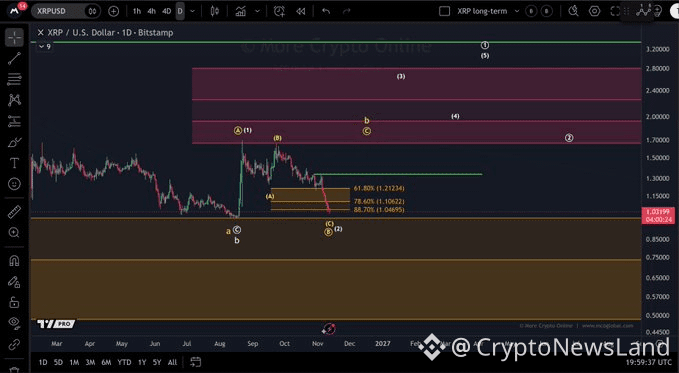
More Crypto Online noted that XRP has lost its ground from the August lows. The analyst observes the asset has been in a wide annual range. This trend has also been observed in Bitcoin and a few key cryptocurrencies.
 Source: X
The daily chart reveals that the previous recovery attempt has stalled and the price is now on a downward trend. XRP was unable to stay within the 61.8% Fibonacci retracement at $1.21234. Sellers then took the asset down close to $1.10622 near the 78.6% support level.
The 88.7% retracement near $1.04695 also did not halt any losses. It had been these 3 levels that had provided potential support in the previous correction. With their loss, the August swing low is coming into view.
Meanwhile, XRP was trading around $1.02 at the time of writing according to coinmarketcap data market data. However, CoinMarketCap had a 1.52% daily drop as trading volume rose. It was reported with a 24-hour trading volume of $2.5 billion, up 40.6%.
The $0.985 August Low Becomes the Main Support Level
The August swing low at $0.985 now marks the next major support. The present level is the baseline for the last recovery. Its value is not derived from Fibonacci but the price structure.
These two numbers of 0.98 and $1.00 are of special interest. Buyers may try to defend this area following the recent down move. A decent bounce should allow XRP to make a further recovery.
But a quick uptick would not indicate a sustained shift. XRP will still have to recover the broken Fibonacci levels. The $1.04695 area is the first significant area above the current trading levels.
If the price fails to hold above this level, then the level of $0.985 could lose its support. The chart then trends towards lower levels in the $0.75 area. Further support is seen around $0.65 and $0.57.
Bitcoin Weakness Could Add Pressure to XRP
Bitcoin's movement continues to be pivotal as XRP continues to push towards its August bottom. More Crypto Online informs that XRP is not doing better than Bitcoin. This exposes the asset to risk in case of the continuation of the wider markets sell-off.
If XRP continues to drop, then it will be under added pressure from Bitcoin. Under those conditions, the analyst believes that XRP will depreciate further. As such, its battle with Bitcoin is a one to keep an eye on.
For the upside, XRP is looking for a break of $1.30. The return to that level would be an early indicator of better prices. Broken Fibonacci levels will have to be addressed after as well.
There are also higher projections on the larger chart ranging from $1.70 to $2.00. Another area is from $2.20 to $2.80, and $3.20 higher. These targets are part of the overall projected Elliott Wave.
The immediate priority is to watch for a continuation of the August support, for now. A $0.985 defence would help to maintain the broad range. On the other hand, if it were a prolonged failure, then lower chart levels would be considered. The next move in bitcoin's evolution could make it even tougher for the buyer.