LINEA IS NEAR A NEW LOW. WHAT SHOULD WE WATCH?
$LINEA /USDT 4H Chart Study | November 14, 2026
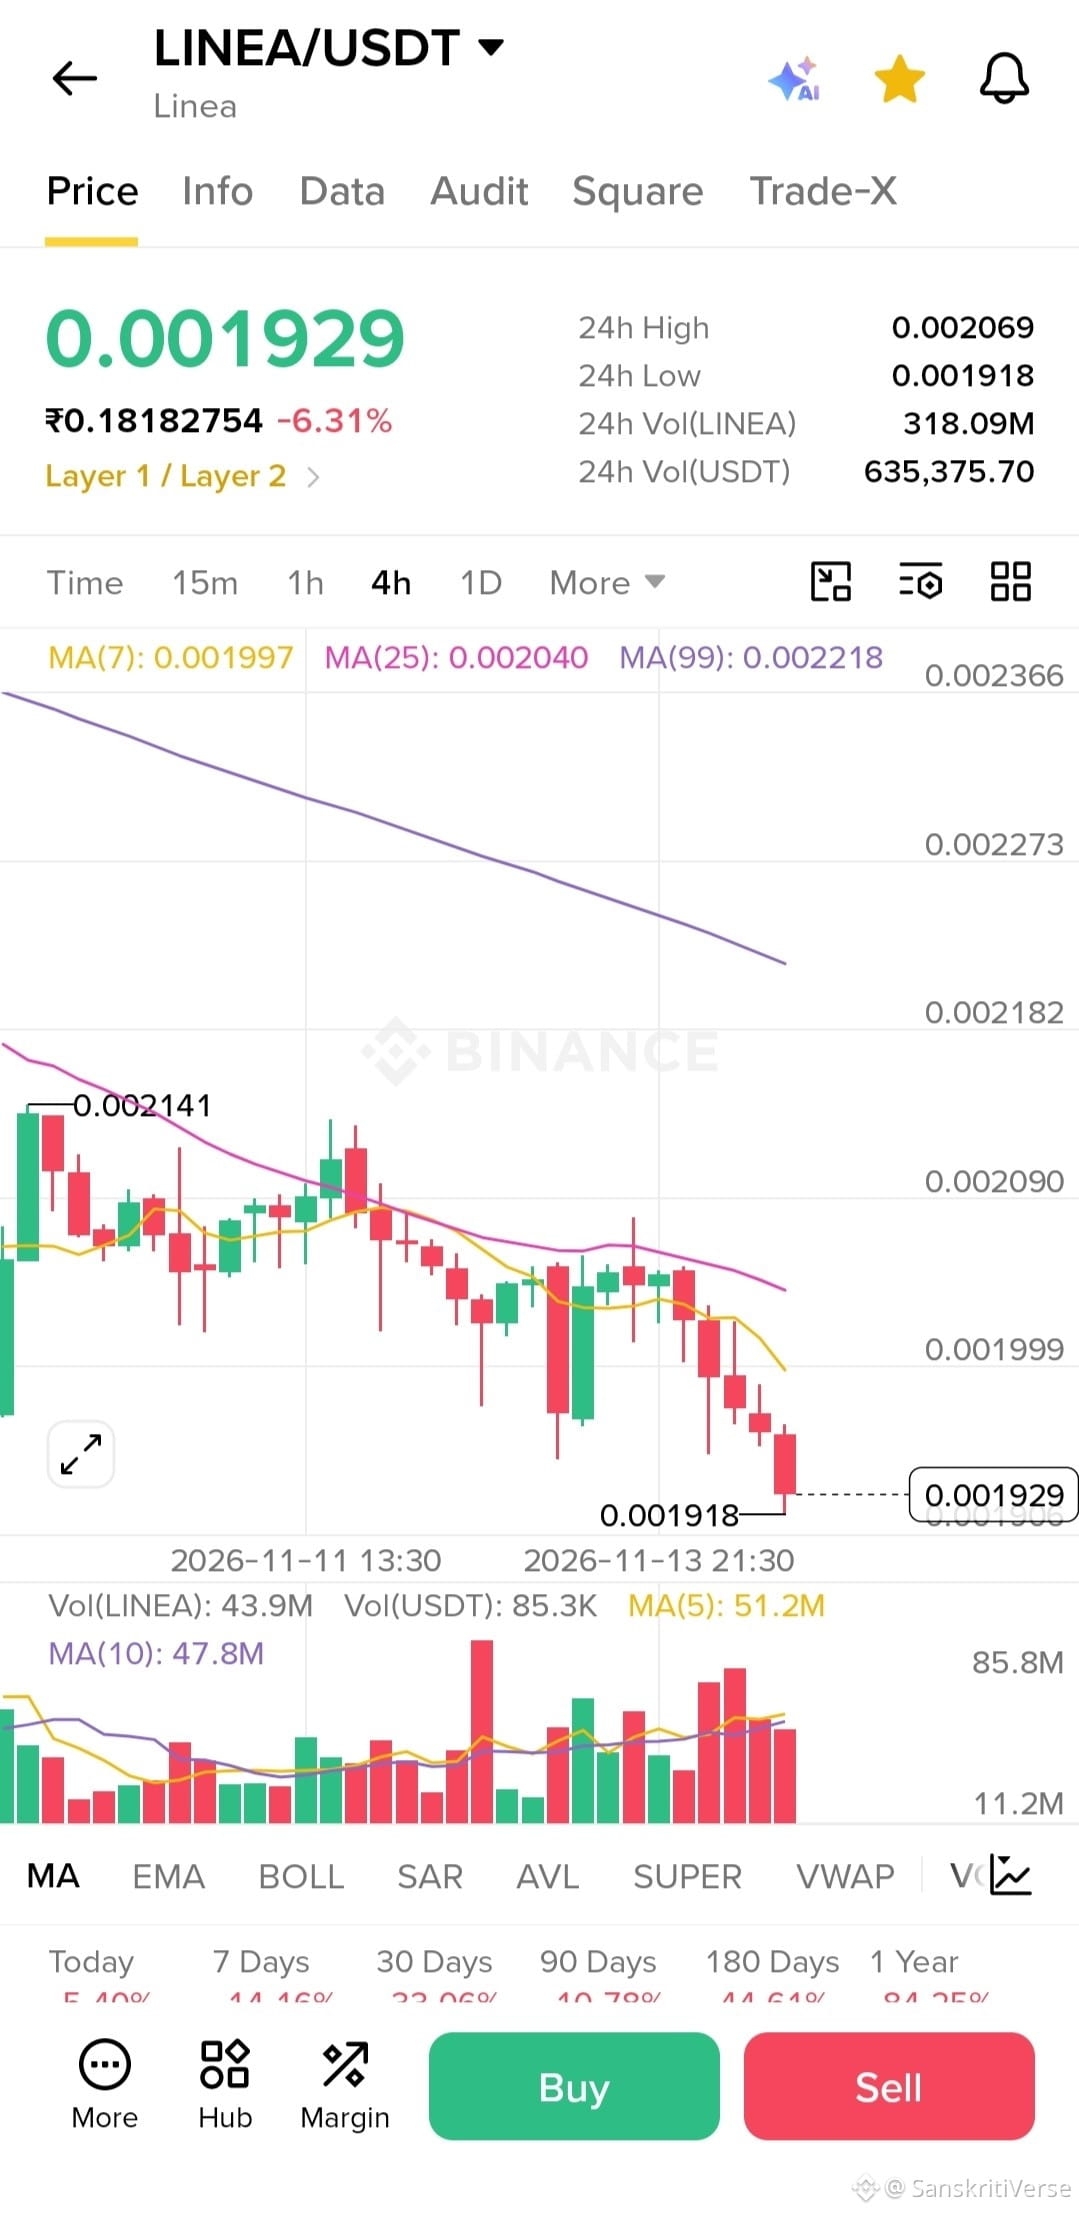
LINEA is trading near $0.001929 in this screenshot, close to the visible low of $0.001918.
The chart shows continued downward movement, with price currently below all three displayed moving averages.
What I'm observing:
Current displayed price: $0.001929
24h low: $0.001918
MA(7): $0.001997
MA(25): $0.002040
MA(99): $0.002218
Displayed volume: 43.9M LINEA, below MA(5) at 51.2M and MA(10) at 47.8M.
What I want to observe next:
Does price move below the visible $0.001918 low?
If it does, can the move sustain after a completed 4H candle?
Or does price recover above the recent low area?
Beginner learning:
When a coin approaches a recent low, it is important not to assume that a breakdown is inevitable.
A temporary move below a level and a confirmed candle close below it are different things.
I also want to distinguish a recent low from an All-Time Low. The screenshot alone does not confirm LINEA's historical ATL.
The current 4H candle may still be open, so its price and displayed volume can change before it closes.
This is a screenshot-based educational observation, not a live trading signal or financial advice.
Question: When a coin approaches a recent low, what do you watch first — a confirmed candle close below it or a possible recovery?
$LINEA
#LINEA #ChartAnalysis #PriceAction #CryptoEducation #LearnInPublic
$LINEA /USDT 4H Chart Study | November 14, 2026
LINEA is trading near $0.001929 in this screenshot, close to the visible low of $0.001918.
The chart shows continued downward movement, with price currently below all three displayed moving averages.
What I'm observing:
Current displayed price: $0.001929
24h low: $0.001918
MA(7): $0.001997
MA(25): $0.002040
MA(99): $0.002218
Displayed volume: 43.9M LINEA, below MA(5) at 51.2M and MA(10) at 47.8M.
What I want to observe next:
Does price move below the visible $0.001918 low?
If it does, can the move sustain after a completed 4H candle?
Or does price recover above the recent low area?
Beginner learning:
When a coin approaches a recent low, it is important not to assume that a breakdown is inevitable.
A temporary move below a level and a confirmed candle close below it are different things.
I also want to distinguish a recent low from an All-Time Low. The screenshot alone does not confirm LINEA's historical ATL.
The current 4H candle may still be open, so its price and displayed volume can change before it closes.
This is a screenshot-based educational observation, not a live trading signal or financial advice.
Question: When a coin approaches a recent low, what do you watch first — a confirmed candle close below it or a possible recovery?
$LINEA
#LINEA #ChartAnalysis #PriceAction #CryptoEducation #LearnInPublic