$TAC Rips Nearly 46%: Can the Bulls Defend the Higher Lows After the Spike?
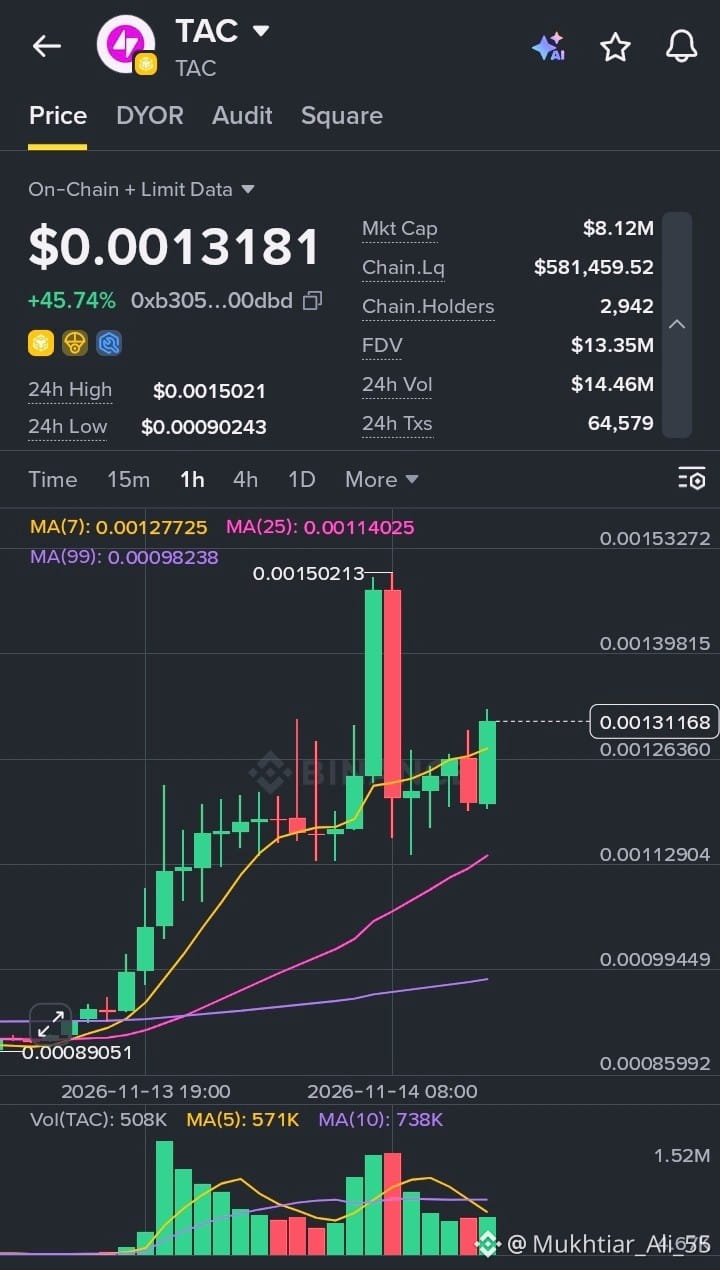
TAC is trading at $0.0013181, up 45.74% over the last 24 hours. The range tells the story: a low of $0.00090243 and a high of $0.0015021, which means price has climbed more than 60% from the bottom of the day to the top.
On the 1H chart, TAC built a steady staircase of green candles out of the $0.00089 area, then exploded into a peak around $0.0015021. Sellers answered right away with a large red candle, but the pullback was shallow and buyers stepped in near $0.00125. Since then price has been grinding back up, and the latest candle is green, pushing toward $0.00131. The structure is strong: price sits above the MA(7) at 0.00127725, with the MA(25) at 0.00114025 and the MA(99) at 0.00098238 all trending upward below it. The gap between price and the longer averages shows how stretched this move is.
Key numbers:
Market Cap: $8.12M
FDV: $13.35M
24h Volume: $14.46M
24h Transactions: 64,579
On-chain Liquidity: $581K
Holders: 2,942
Volume stands out. $14.46M in 24h volume against an $8.12M market cap is heavy turnover, and the transaction count of 64,579 confirms there is real activity behind the move. Volume was strongest during the breakout and the rejection candle, then cooled during the recovery, which is worth watching. With liquidity at only around $581K and a small holder base, price can swing hard in either direction.
What I’m watching:
Support: $0.00127 (MA7), then $0.00114 (MA25), and $0.00098 (MA99)
Resistance: $0.00140, then the $0.0015 high
A clean break above $0.0014 on rising volume would put the high back in play, while a close below the MA(7) could open a pullback toward the MA(25)
After a move this fast, the market usually needs time to digest. I’d rather watch how TAC behaves on the next dip than chase a green candle near the highs.
#TAC #CryptoAnalysis #BinanceSquare #TechnicalAnalysis #AltcoinWatch
$TAC
TAC is trading at $0.0013181, up 45.74% over the last 24 hours. The range tells the story: a low of $0.00090243 and a high of $0.0015021, which means price has climbed more than 60% from the bottom of the day to the top.
On the 1H chart, TAC built a steady staircase of green candles out of the $0.00089 area, then exploded into a peak around $0.0015021. Sellers answered right away with a large red candle, but the pullback was shallow and buyers stepped in near $0.00125. Since then price has been grinding back up, and the latest candle is green, pushing toward $0.00131. The structure is strong: price sits above the MA(7) at 0.00127725, with the MA(25) at 0.00114025 and the MA(99) at 0.00098238 all trending upward below it. The gap between price and the longer averages shows how stretched this move is.
Key numbers:
Market Cap: $8.12M
FDV: $13.35M
24h Volume: $14.46M
24h Transactions: 64,579
On-chain Liquidity: $581K
Holders: 2,942
Volume stands out. $14.46M in 24h volume against an $8.12M market cap is heavy turnover, and the transaction count of 64,579 confirms there is real activity behind the move. Volume was strongest during the breakout and the rejection candle, then cooled during the recovery, which is worth watching. With liquidity at only around $581K and a small holder base, price can swing hard in either direction.
What I’m watching:
Support: $0.00127 (MA7), then $0.00114 (MA25), and $0.00098 (MA99)
Resistance: $0.00140, then the $0.0015 high
A clean break above $0.0014 on rising volume would put the high back in play, while a close below the MA(7) could open a pullback toward the MA(25)
After a move this fast, the market usually needs time to digest. I’d rather watch how TAC behaves on the next dip than chase a green candle near the highs.
#TAC #CryptoAnalysis #BinanceSquare #TechnicalAnalysis #AltcoinWatch
$TAC