$AIN Holds a Steady Uptrend: Higher Lows Keep the Bulls in Control
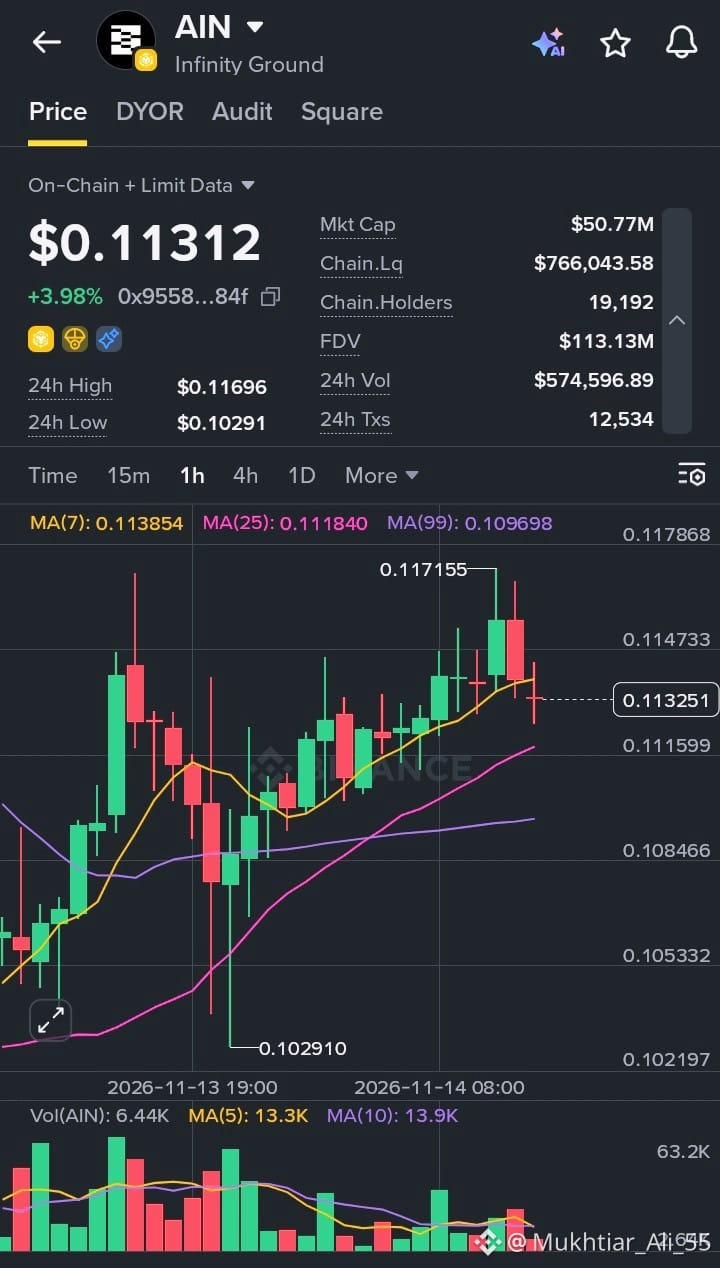
Infinity Ground (AIN) is trading at $0.11312, up 3.98% over the last 24 hours. The day’s range runs from a low of $0.10291 to a high of $0.11696, a moderate move that has played out in a fairly orderly way.
On the 1H chart, AIN has been building a clear staircase of higher lows. After a sharp dip toward $0.1029 that was bought up almost immediately, price recovered and pushed to a local high around $0.1172. Since that peak, the market has cooled slightly, with a couple of red candles pulling price back to the $0.113 area. Price is now testing the MA(7) at 0.113854 from below, while staying comfortably above the MA(25) at 0.111840 and the MA(99) at 0.109698. Both of those averages are sloping upward, which supports the broader bullish structure.
Key numbers:
Market Cap: $50.77M
FDV: $113.13M
24h Volume: $574.6K
24h Transactions: 12,534
On-chain Liquidity: $766K
Holders: 19,192
Volume is the one area to watch here. Recent candles show participation fading compared to earlier in the session, and 24h volume is modest relative to market cap. That means the current pullback looks like a quiet breather rather than aggressive selling, but it also means a fresh move higher will need volume to back it up. With liquidity around $766K, price can move quickly when activity picks up. The gap between market cap and FDV is also worth keeping in mind, since future supply releases can add pressure over time.
What I’m watching:
Support: $0.1118 (MA25), then $0.1097 (MA99)
Resistance: $0.1139 (MA7), then $0.1172 high
A reclaim of the MA(7) on rising volume would keep the uptrend healthy, while a close below the MA(25) could open a deeper pullback
The trend is still constructive, but momentum is cooling. I’d rather see how price reacts at the MA(25) than assume the next leg up is guaranteed.
#AIN #InfinityGround #CryptoAnalysis #BinanceSquare #TechnicalAnalysis
$AIN
Infinity Ground (AIN) is trading at $0.11312, up 3.98% over the last 24 hours. The day’s range runs from a low of $0.10291 to a high of $0.11696, a moderate move that has played out in a fairly orderly way.
On the 1H chart, AIN has been building a clear staircase of higher lows. After a sharp dip toward $0.1029 that was bought up almost immediately, price recovered and pushed to a local high around $0.1172. Since that peak, the market has cooled slightly, with a couple of red candles pulling price back to the $0.113 area. Price is now testing the MA(7) at 0.113854 from below, while staying comfortably above the MA(25) at 0.111840 and the MA(99) at 0.109698. Both of those averages are sloping upward, which supports the broader bullish structure.
Key numbers:
Market Cap: $50.77M
FDV: $113.13M
24h Volume: $574.6K
24h Transactions: 12,534
On-chain Liquidity: $766K
Holders: 19,192
Volume is the one area to watch here. Recent candles show participation fading compared to earlier in the session, and 24h volume is modest relative to market cap. That means the current pullback looks like a quiet breather rather than aggressive selling, but it also means a fresh move higher will need volume to back it up. With liquidity around $766K, price can move quickly when activity picks up. The gap between market cap and FDV is also worth keeping in mind, since future supply releases can add pressure over time.
What I’m watching:
Support: $0.1118 (MA25), then $0.1097 (MA99)
Resistance: $0.1139 (MA7), then $0.1172 high
A reclaim of the MA(7) on rising volume would keep the uptrend healthy, while a close below the MA(25) could open a deeper pullback
The trend is still constructive, but momentum is cooling. I’d rather see how price reacts at the MA(25) than assume the next leg up is guaranteed.
#AIN #InfinityGround #CryptoAnalysis #BinanceSquare #TechnicalAnalysis
$AIN