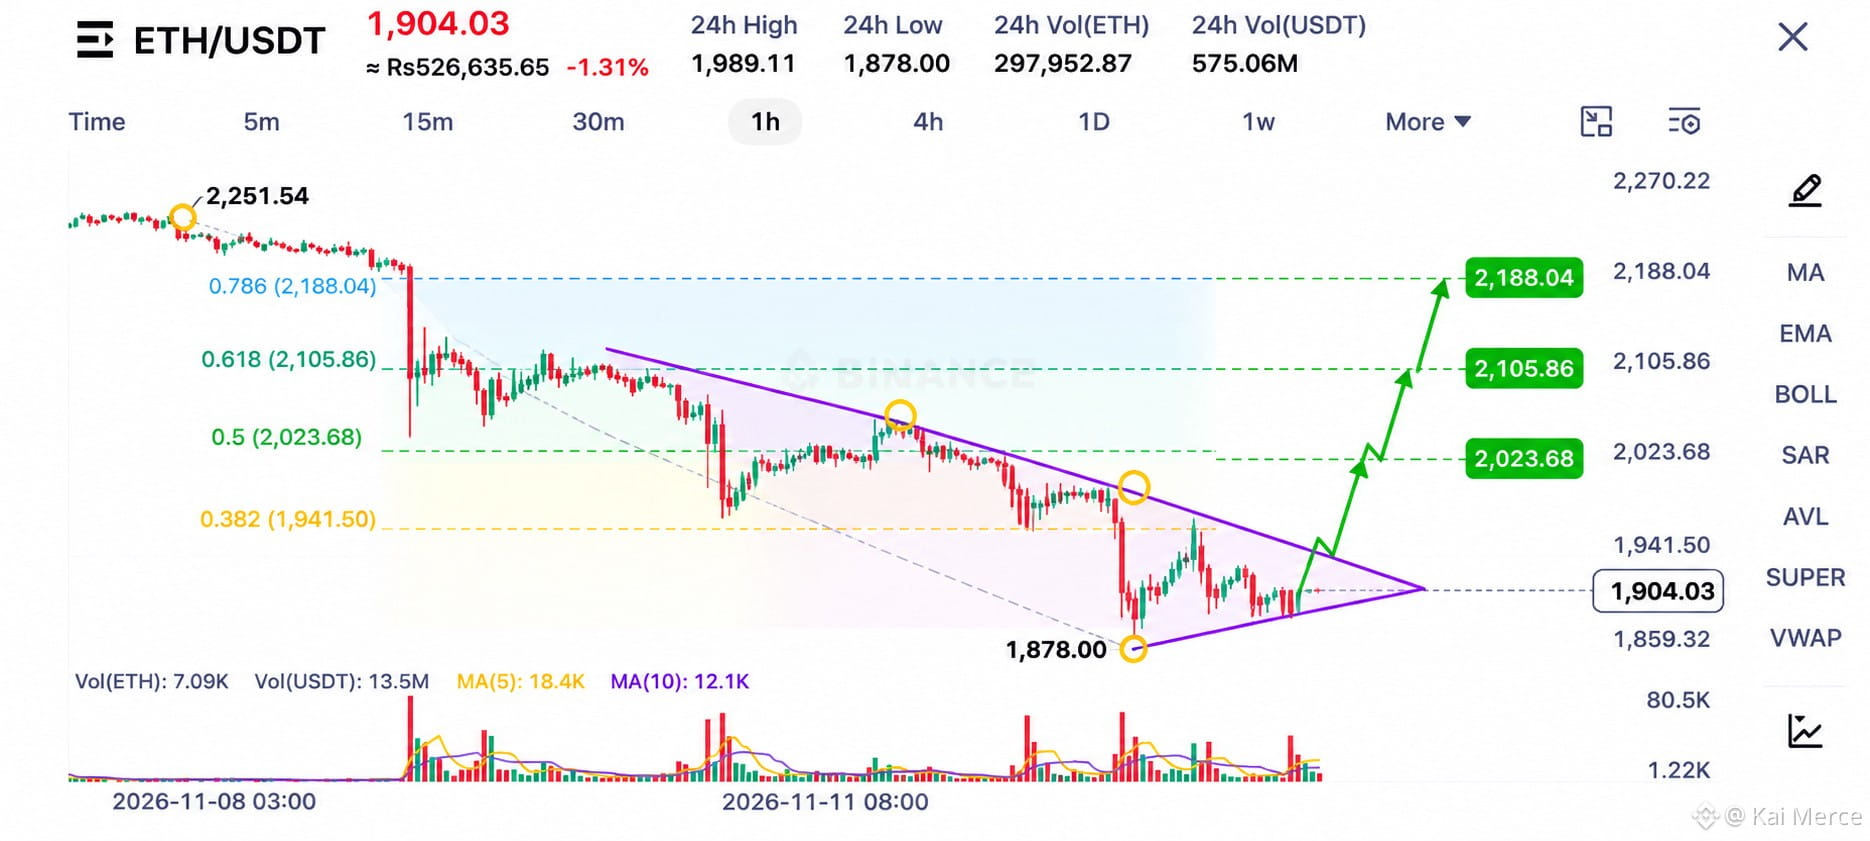

$ETH Ethereum Forms a Tight Triangle Ahead of a Potential Breakout
Long Setup
Entry Zone: 1,890–1,915
Stop Loss: 1,870
TP1: 2,023.68
TP2: 2,105.86
TP3: 2,188.04
Market Structure Analysis
Ethereum is approaching a critical turning point as price action develops inside a converging triangle pattern on the 1H chart. The market is currently trading around 1,904 after testing the 1,878 support level, where buyers have started showing signs of interest.
The descending purple resistance trendline continues to limit upside movement, while the rising lower trendline is providing support. This creates a tightening price structure, suggesting that a significant move could develop once ETH escapes the pattern.
The immediate resistance zone sits around 1,941.50. A confirmed breakout above this level could strengthen bullish momentum and bring the 2,023.68 Fibonacci level into focus.
If buyers maintain control, the next upside objectives are 2,105.86 and 2,188.04. These levels represent important Fibonacci resistance areas where sellers may attempt to slow the recovery.
Key Levels to Watch
The 1,878 support level is the most important downside reference. Holding above this area could allow the triangle structure to develop into a bullish breakout.
However, a decisive breakdown below support would weaken the bullish outlook and increase the possibility of further downside pressure.
Trading Strategy
Patience is essential while ETH remains inside the triangle. A strong 1H candle close above descending resistance, supported by increasing volume, would provide a stronger bullish confirmation.
Ethereum is approaching a major technical decision point. The next confirmed move could determine its short-term direction.
Trade with discipline and manage risk carefully.
Long Setup
Entry Zone: 1,890–1,915
Stop Loss: 1,870
TP1: 2,023.68
TP2: 2,105.86
TP3: 2,188.04
Market Structure Analysis
Ethereum is approaching a critical turning point as price action develops inside a converging triangle pattern on the 1H chart. The market is currently trading around 1,904 after testing the 1,878 support level, where buyers have started showing signs of interest.
The descending purple resistance trendline continues to limit upside movement, while the rising lower trendline is providing support. This creates a tightening price structure, suggesting that a significant move could develop once ETH escapes the pattern.
The immediate resistance zone sits around 1,941.50. A confirmed breakout above this level could strengthen bullish momentum and bring the 2,023.68 Fibonacci level into focus.
If buyers maintain control, the next upside objectives are 2,105.86 and 2,188.04. These levels represent important Fibonacci resistance areas where sellers may attempt to slow the recovery.
Key Levels to Watch
The 1,878 support level is the most important downside reference. Holding above this area could allow the triangle structure to develop into a bullish breakout.
However, a decisive breakdown below support would weaken the bullish outlook and increase the possibility of further downside pressure.
Trading Strategy
Patience is essential while ETH remains inside the triangle. A strong 1H candle close above descending resistance, supported by increasing volume, would provide a stronger bullish confirmation.
Ethereum is approaching a major technical decision point. The next confirmed move could determine its short-term direction.
Trade with discipline and manage risk carefully.