$STRK: VWAP Mechanics Check
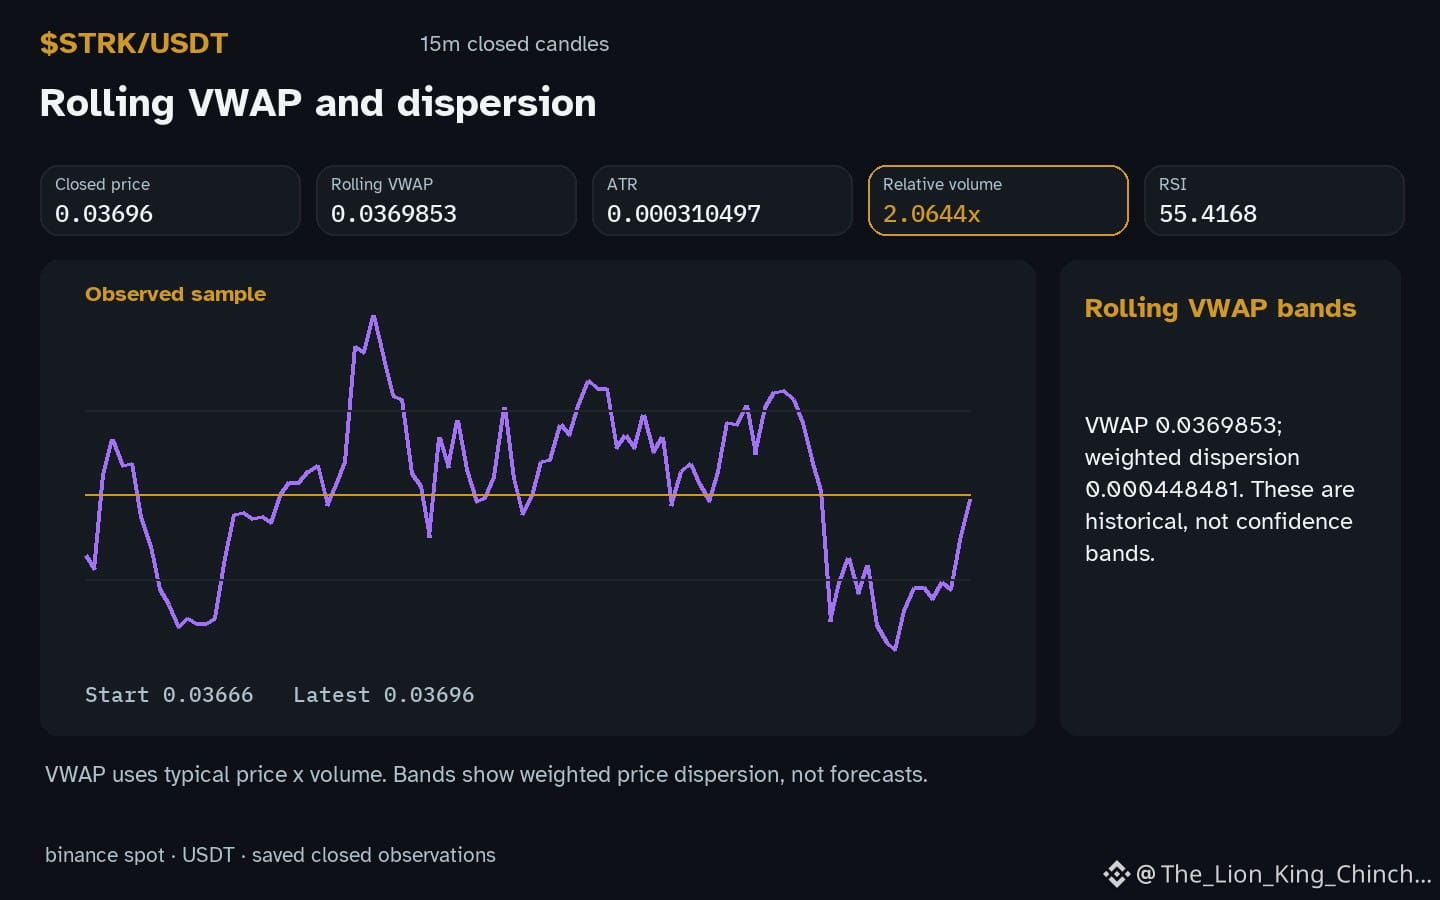
Has $STRK volume above its baseline convinced you that 0.0369853 acts as a floor? The chart sits 55.4 with relative volume at 2.06x. A hypothetical habit: staring until the line glows. Then the mind rushes while the watchlist stays calm.
The trap.
VWAP weights trades by size, not intent. If one large buyer lifts the average, it does not prove persistence. A buyer pushing just below 0.0369853 could still pull the metric slightly, changing the reference point. The average moves with activity. It is not a wall.
Consider a counterexample. If execution concentrates heavily away from the typical flow, the mean shifts. The current reading of 0.0369853 reflects past trades. It does not obligate future price to respect it. A recent spike can skew the value, making it appear stronger than the underlying flow suggests.
Self-check.
Compare the distance from price to the support at 0.03592. If the gap exceeds expected noise, the average may be less relevant. Ask if the volume spike was a single event or a steady accumulation. A one-off burst creates a temporary skew. It does not create a structural level.
What could change the reading. Look for a new baseline forming away from the historical average. If price closes below 0.03592, the previous VWAP context may expire. The rule should update with the data. Do not force the old average to fit the new reality. The metric serves the price, not the other way around.
Probabilistic market research, not a recommendation or guaranteed return.
A useful cross-check: $BTC has hourly direction up and volume not above its baseline; $SHELL has hourly direction up and volume above its baseline. This alone does not establish correlation.
#STRK #BTC
Has $STRK volume above its baseline convinced you that 0.0369853 acts as a floor? The chart sits 55.4 with relative volume at 2.06x. A hypothetical habit: staring until the line glows. Then the mind rushes while the watchlist stays calm.
The trap.
VWAP weights trades by size, not intent. If one large buyer lifts the average, it does not prove persistence. A buyer pushing just below 0.0369853 could still pull the metric slightly, changing the reference point. The average moves with activity. It is not a wall.
Consider a counterexample. If execution concentrates heavily away from the typical flow, the mean shifts. The current reading of 0.0369853 reflects past trades. It does not obligate future price to respect it. A recent spike can skew the value, making it appear stronger than the underlying flow suggests.
Self-check.
Compare the distance from price to the support at 0.03592. If the gap exceeds expected noise, the average may be less relevant. Ask if the volume spike was a single event or a steady accumulation. A one-off burst creates a temporary skew. It does not create a structural level.
What could change the reading. Look for a new baseline forming away from the historical average. If price closes below 0.03592, the previous VWAP context may expire. The rule should update with the data. Do not force the old average to fit the new reality. The metric serves the price, not the other way around.
Probabilistic market research, not a recommendation or guaranteed return.
A useful cross-check: $BTC has hourly direction up and volume not above its baseline; $SHELL has hourly direction up and volume above its baseline. This alone does not establish correlation.
#STRK #BTC