$DASH : Patterns in the Noise
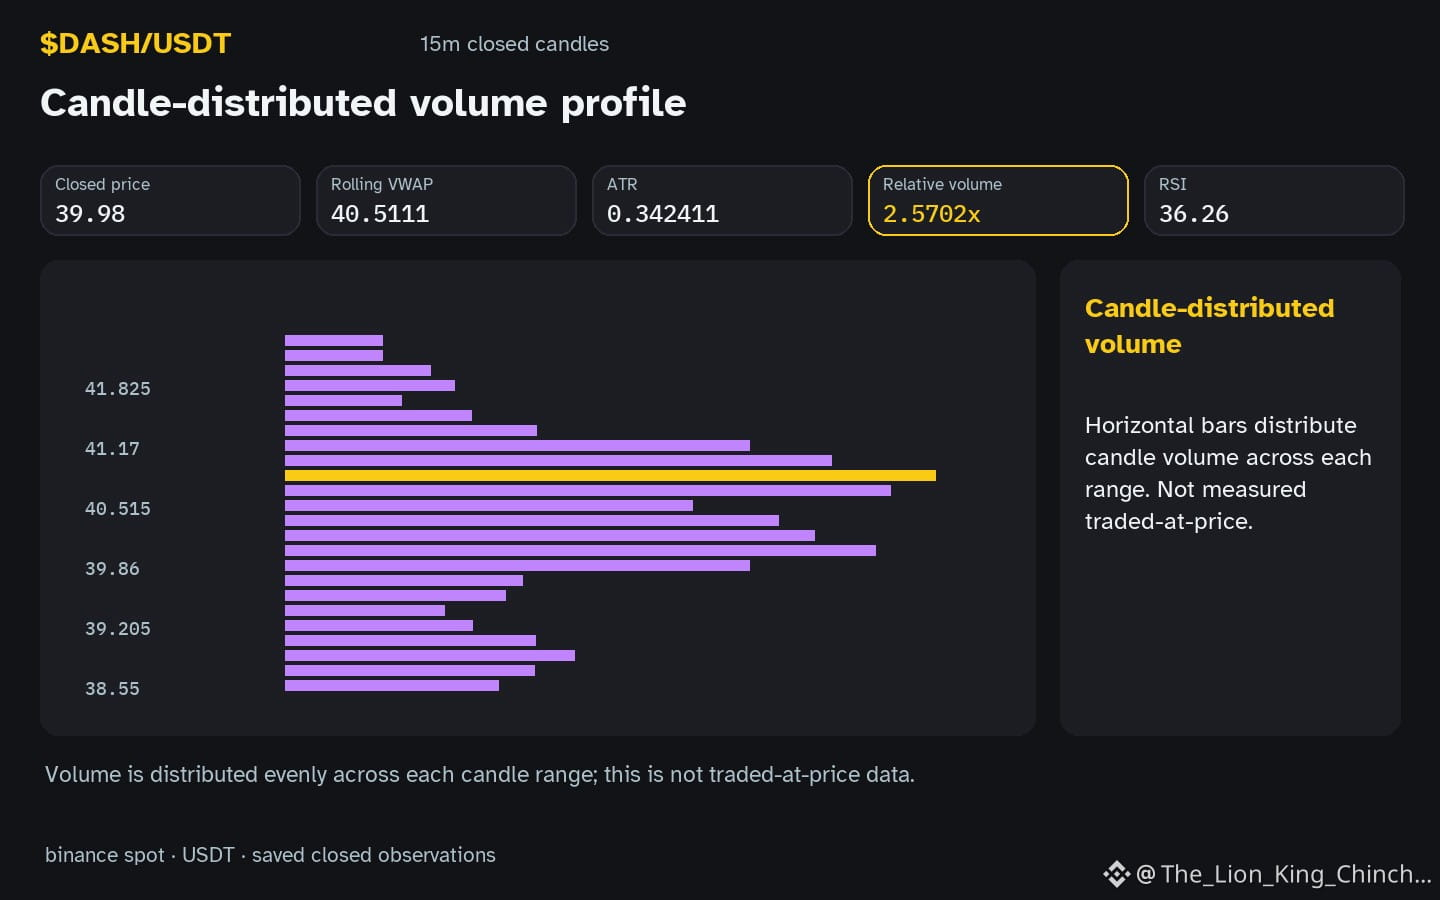
Does a sudden increase in activity for $DASH signify a major shift, or is it merely a typical fluctuation? The current observation shows $DASH moving within its recorded range while relative volume sits at 2.57x baseline.
### The tempting shortcut
A common cognitive bias involves assigning deep meaning to random or normal variations. When relative volume rises above the baseline during a downward hourly change of -1.47856%, a person might imagine large players are entering or exiting. This tendency to find patterns in unrelated noise can lead to over-interpreting every candle. One might assume that higher activity always precedes a trend change, yet volume often fluctuates without any directional follow-through.
### A more careful interpretation
Instead of assuming a hidden cause, consider the possibility that this activity is just normal market friction. For example, the RSI is currently at 36.3, suggesting the momentum is neither at its historical extremes nor particularly unusual. If volume remains high while price stays within the local bounds of 39.69 and 41.43, it may indicate simple churn rather than a strategic move. A self-check is helpful: would I still find this volume significant if the price were not moving at all?
### A useful next observation
A way to reassess this is to look for a closed-candle confirmation outside the current range. If the price breaks a level but volume immediately drops back to the baseline, it suggests the earlier activity was not part of a sustained expansion. Observing if future candles maintain this intensity can help distinguish a temporary spike from a genuine shift in participation.
Probabilistic market research, not a recommendation or guaranteed return.
#DASH
Does a sudden increase in activity for $DASH signify a major shift, or is it merely a typical fluctuation? The current observation shows $DASH moving within its recorded range while relative volume sits at 2.57x baseline.
### The tempting shortcut
A common cognitive bias involves assigning deep meaning to random or normal variations. When relative volume rises above the baseline during a downward hourly change of -1.47856%, a person might imagine large players are entering or exiting. This tendency to find patterns in unrelated noise can lead to over-interpreting every candle. One might assume that higher activity always precedes a trend change, yet volume often fluctuates without any directional follow-through.
### A more careful interpretation
Instead of assuming a hidden cause, consider the possibility that this activity is just normal market friction. For example, the RSI is currently at 36.3, suggesting the momentum is neither at its historical extremes nor particularly unusual. If volume remains high while price stays within the local bounds of 39.69 and 41.43, it may indicate simple churn rather than a strategic move. A self-check is helpful: would I still find this volume significant if the price were not moving at all?
### A useful next observation
A way to reassess this is to look for a closed-candle confirmation outside the current range. If the price breaks a level but volume immediately drops back to the baseline, it suggests the earlier activity was not part of a sustained expansion. Observing if future candles maintain this intensity can help distinguish a temporary spike from a genuine shift in participation.
Probabilistic market research, not a recommendation or guaranteed return.
#DASH