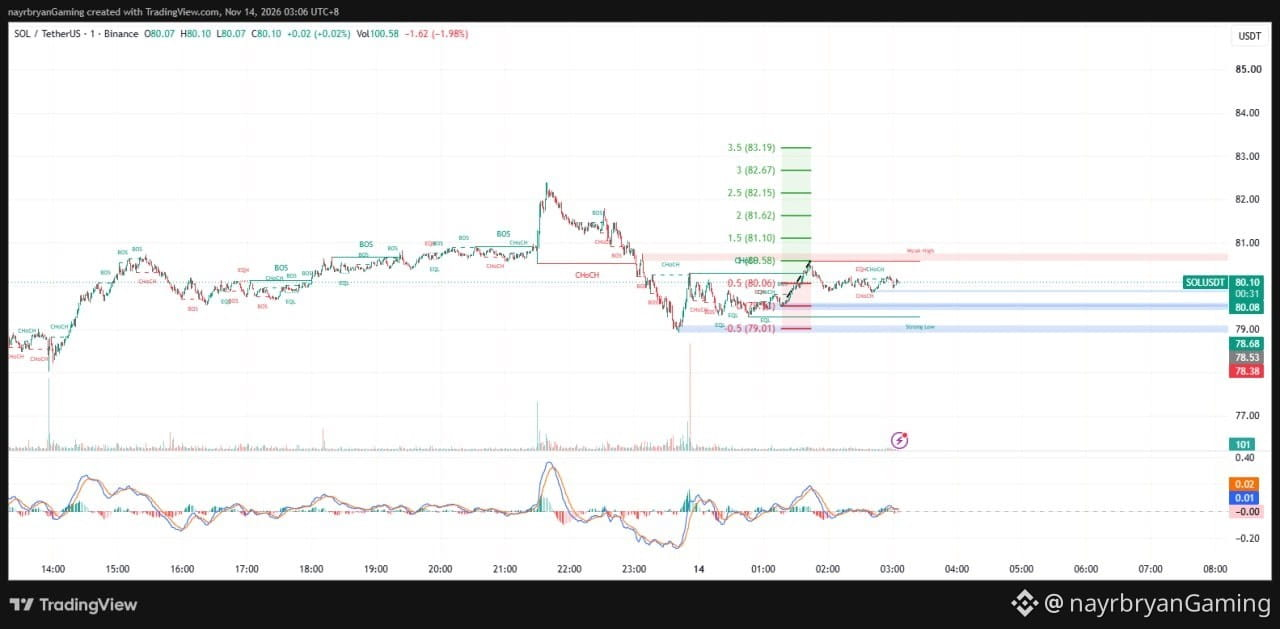
LIGHT ANALYSIS / CHART SETUP — SOL/USDT
📈 STRUCTURE OVERVIEW
Market Phase:
Bearish impulse → Recovery → Sideways consolidation
Current Price:
80.10
Immediate Fibonacci Reference:
80.06
Immediate Resistance:
80.58
Major Supply:
80.58–80.80
Weak-High Reference:
Approximately 80.80
Intermediate Support:
Around 79.50
Major Demand Reference:
79.01
Lower Chart References:
78.68–78.38
---
📌 WHAT I'M WATCHING
SCENARIO A — BULLISH RECOVERY
If SOL maintains its current structure and successfully reclaims 80.58, price may attempt a rotation toward:
80.80 → 81.10 → 81.62 → 82.15.
A sustained breakout above the supply zone would strengthen the bullish recovery scenario.
Watch for increased volume and consecutive bullish candles.
SCENARIO B — BEARISH CONTINUATION
If SOL fails to reclaim 80.58–80.80 and sellers regain control, price could revisit:
79.50 → 79.01 → 78.68 → 78.53.
A confirmed breakdown below the lower demand structure would weaken the recovery attempt.
---
📊 INDICATOR CHECK
MACD:
Approximately +0.01 versus +0.02 signal.
Histogram:
Near neutral.
Price Structure:
Recovery following a significant bearish impulse.
Current Price:
80.10.
Immediate Resistance:
80.58.
Major Supply:
80.58–80.80.
Intermediate Support:
Around 79.50.
Major Downside Reference:
79.01.
Bullish Confirmation:
Sustained breakout above 80.80.
Bearish Warning:
Rejection from supply followed by confirmed support breakdown.
---
📝 CHART NOTE
SOL is consolidating after its previous sharp decline.
The recovery has not yet established a confirmed bullish reversal.
The 80.58–80.80 supply area remains an important resistance region.
Monitor whether buyers can reclaim this area or sellers initiate another move toward lower demand.
Avoid anticipating a breakout before confirmation.
This is an educational chart framework, not a trade recommendation.
— @nayrbryanGaming
#SOLAnalysis #ChartSetup #PriceAction #SmartMoney #Fibonacci #CryptoTrading #TechnicalAnalysis #MACD #DYOR #NFA
━━━━━━━━━━━━━━━━━━
📈 STRUCTURE OVERVIEW
Market Phase:
Bearish impulse → Recovery → Sideways consolidation
Current Price:
80.10
Immediate Fibonacci Reference:
80.06
Immediate Resistance:
80.58
Major Supply:
80.58–80.80
Weak-High Reference:
Approximately 80.80
Intermediate Support:
Around 79.50
Major Demand Reference:
79.01
Lower Chart References:
78.68–78.38
---
📌 WHAT I'M WATCHING
SCENARIO A — BULLISH RECOVERY
If SOL maintains its current structure and successfully reclaims 80.58, price may attempt a rotation toward:
80.80 → 81.10 → 81.62 → 82.15.
A sustained breakout above the supply zone would strengthen the bullish recovery scenario.
Watch for increased volume and consecutive bullish candles.
SCENARIO B — BEARISH CONTINUATION
If SOL fails to reclaim 80.58–80.80 and sellers regain control, price could revisit:
79.50 → 79.01 → 78.68 → 78.53.
A confirmed breakdown below the lower demand structure would weaken the recovery attempt.
---
📊 INDICATOR CHECK
MACD:
Approximately +0.01 versus +0.02 signal.
Histogram:
Near neutral.
Price Structure:
Recovery following a significant bearish impulse.
Current Price:
80.10.
Immediate Resistance:
80.58.
Major Supply:
80.58–80.80.
Intermediate Support:
Around 79.50.
Major Downside Reference:
79.01.
Bullish Confirmation:
Sustained breakout above 80.80.
Bearish Warning:
Rejection from supply followed by confirmed support breakdown.
---
📝 CHART NOTE
SOL is consolidating after its previous sharp decline.
The recovery has not yet established a confirmed bullish reversal.
The 80.58–80.80 supply area remains an important resistance region.
Monitor whether buyers can reclaim this area or sellers initiate another move toward lower demand.
Avoid anticipating a breakout before confirmation.
This is an educational chart framework, not a trade recommendation.
— @nayrbryanGaming
#SOLAnalysis #ChartSetup #PriceAction #SmartMoney #Fibonacci #CryptoTrading #TechnicalAnalysis #MACD #DYOR #NFA
━━━━━━━━━━━━━━━━━━