$BTC bottom will be $54k, Don't believe it? save this post and read my analysis before making any comment:
Here's my framework after mapping every cycle since 2013
⏳ 1. TIME IS ALMOST UP
Past bear markets bottomed 363–410 days after the peak (2015: 406 · 2018: 363 · 2022: 376).
The ATH was 6 Oct 2025. Today is day 403.
Time says the bottom is close, but in 2018 and 2022 the final low came with one last capitulation leg that broke the mid-bear low.
🔵 2. ZONE A: $62–66K (~30%)
The bull-case floor. A real confluence:
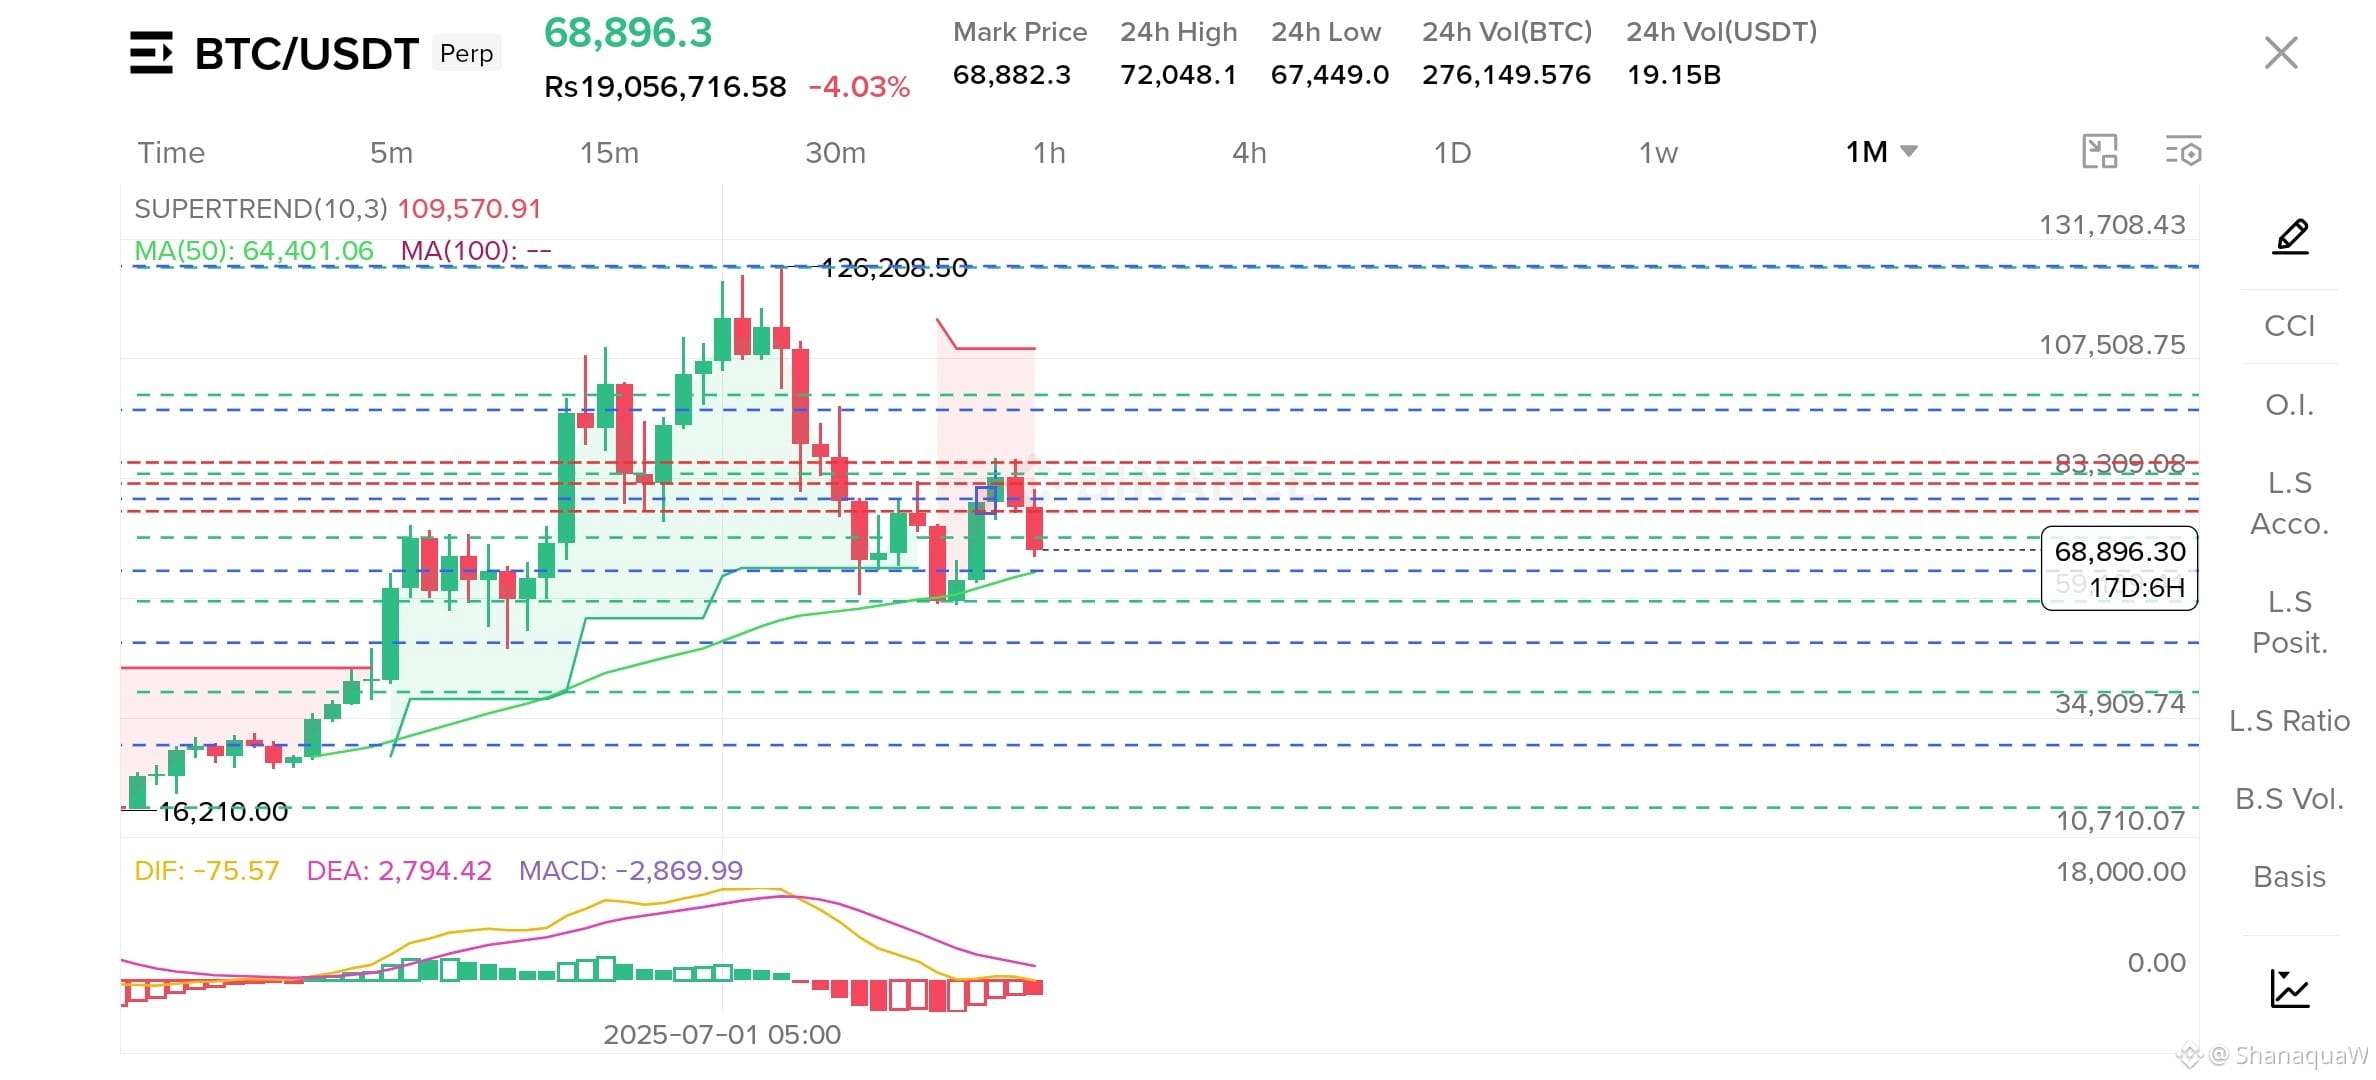
• Monthly MA50 (the line that held the $57.7K July low) has now risen to ~$63–64K
• 0.5 retracement of $3.6K → $126.2K (linear) = ~$64.9K
• March structure low ~$65K
If BTC holds here, the July low was the cycle bottom.
🟠 3. ZONE B: $52–58K (base case, ~35%)
Where the weight of evidence points:
• Realized price (aggregate on-chain cost basis) ≈ $52–54K. Every major bear-market low has traded at or below it.
• A sweep of the $57.7K July low fits the historical pattern: final lows undercut the mid-bear low.
• The 0.618 fib (linear) sits at ~$50.4K, just below the zone.
📊 WHY I'M NOT CALLING THE BOTTOM YET
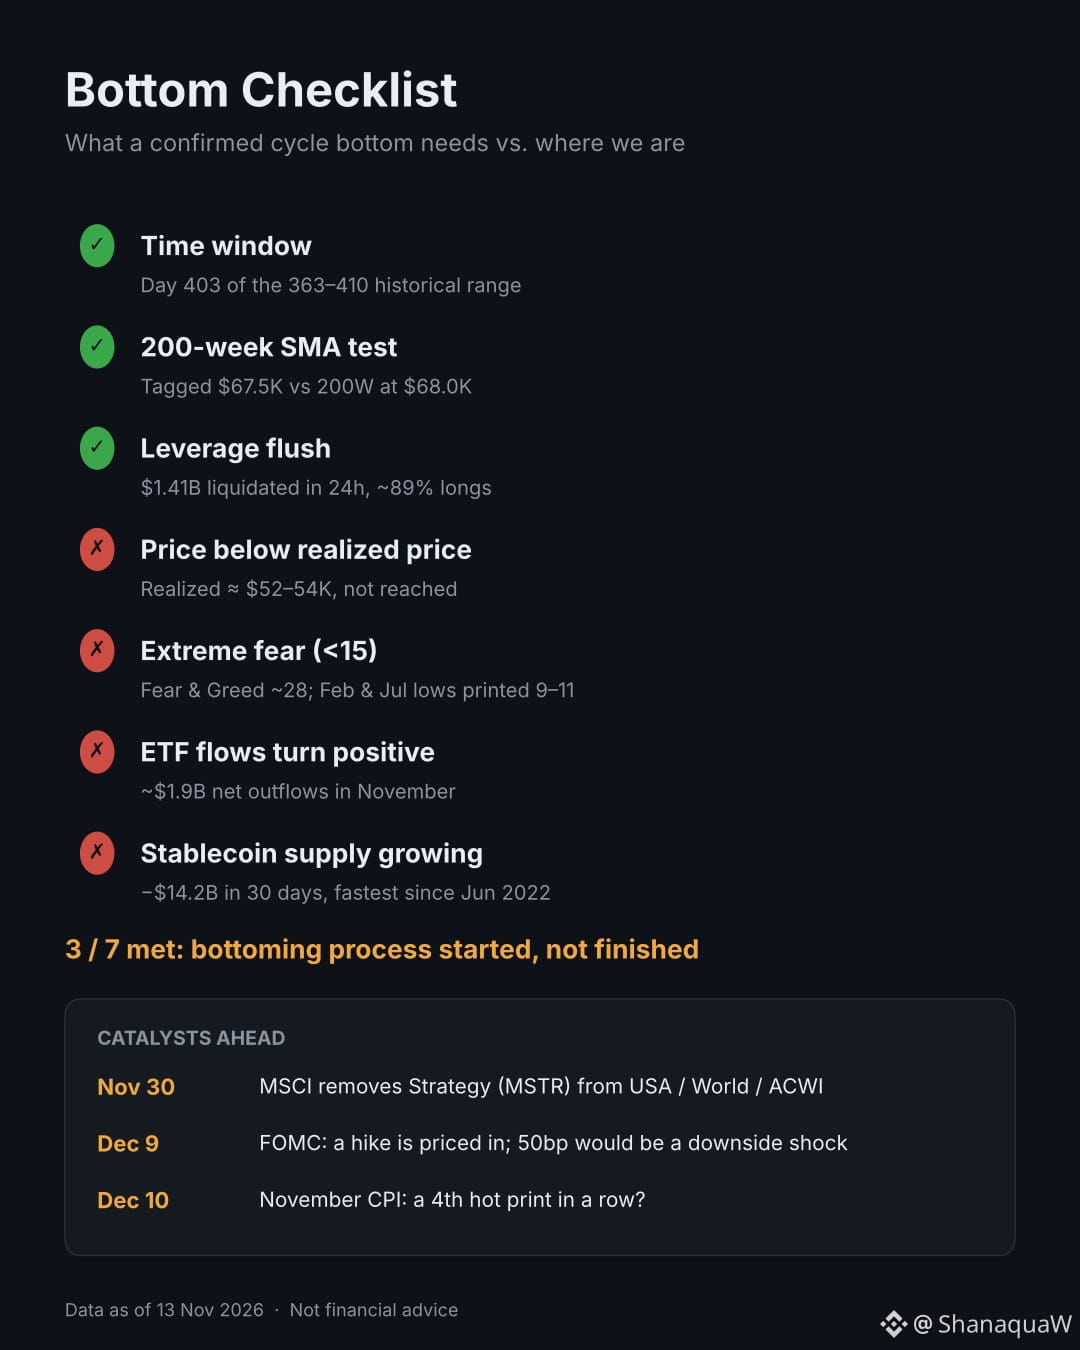
Only 3 of 7 bottom signals are confirmed:
✅ Time window
✅ 200W SMA test
✅ Leverage flush ($1.41B liquidated, ~89% longs)
❌ Price below realized price
❌ Extreme fear (F&G ~28; the Feb and Jul lows printed 9–11)
❌ ETF flows positive (~$1.9B outflows in November)
❌ Stablecoin supply growing (−$14.2B in 30d, fastest since Jun 2022)
📅 CATALYSTS
Nov 30: MSCI removes $MSTR from its indexes. (Note: this forces selling of MSTR shares, not BTC. Spot ETFs are not forced to sell.)
Dec 9: FOMC
Dec 10: CPI
🎯 MY PLAN
Scale in, don't guess. Bids staggered from $64K down to $52K, weighted toward Zone B.
Bear confirmation: a weekly close below the 200W SMA.
Bull invalidation: a weekly close back above ~$78K, with ETF inflows returning.
Which zone U think will hit A or B
#Bitcoin #CryptoAnalysis #BTCBottom #MarketOutlook
Here's my framework after mapping every cycle since 2013
⏳ 1. TIME IS ALMOST UP
Past bear markets bottomed 363–410 days after the peak (2015: 406 · 2018: 363 · 2022: 376).
The ATH was 6 Oct 2025. Today is day 403.
Time says the bottom is close, but in 2018 and 2022 the final low came with one last capitulation leg that broke the mid-bear low.
🔵 2. ZONE A: $62–66K (~30%)
The bull-case floor. A real confluence:
• Monthly MA50 (the line that held the $57.7K July low) has now risen to ~$63–64K
• 0.5 retracement of $3.6K → $126.2K (linear) = ~$64.9K
• March structure low ~$65K
If BTC holds here, the July low was the cycle bottom.
🟠 3. ZONE B: $52–58K (base case, ~35%)
Where the weight of evidence points:
• Realized price (aggregate on-chain cost basis) ≈ $52–54K. Every major bear-market low has traded at or below it.
• A sweep of the $57.7K July low fits the historical pattern: final lows undercut the mid-bear low.
• The 0.618 fib (linear) sits at ~$50.4K, just below the zone.
📊 WHY I'M NOT CALLING THE BOTTOM YET
Only 3 of 7 bottom signals are confirmed:
✅ Time window
✅ 200W SMA test
✅ Leverage flush ($1.41B liquidated, ~89% longs)
❌ Price below realized price
❌ Extreme fear (F&G ~28; the Feb and Jul lows printed 9–11)
❌ ETF flows positive (~$1.9B outflows in November)
❌ Stablecoin supply growing (−$14.2B in 30d, fastest since Jun 2022)
📅 CATALYSTS
Nov 30: MSCI removes $MSTR from its indexes. (Note: this forces selling of MSTR shares, not BTC. Spot ETFs are not forced to sell.)
Dec 9: FOMC
Dec 10: CPI
🎯 MY PLAN
Scale in, don't guess. Bids staggered from $64K down to $52K, weighted toward Zone B.
Bear confirmation: a weekly close below the 200W SMA.
Bull invalidation: a weekly close back above ~$78K, with ETF inflows returning.
Which zone U think will hit A or B
#Bitcoin #CryptoAnalysis #BTCBottom #MarketOutlook