
🔴 $ETH — THE LAST MAJOR SUPPORT BEFORE ANOTHER POTENTIAL LEG DOWN?
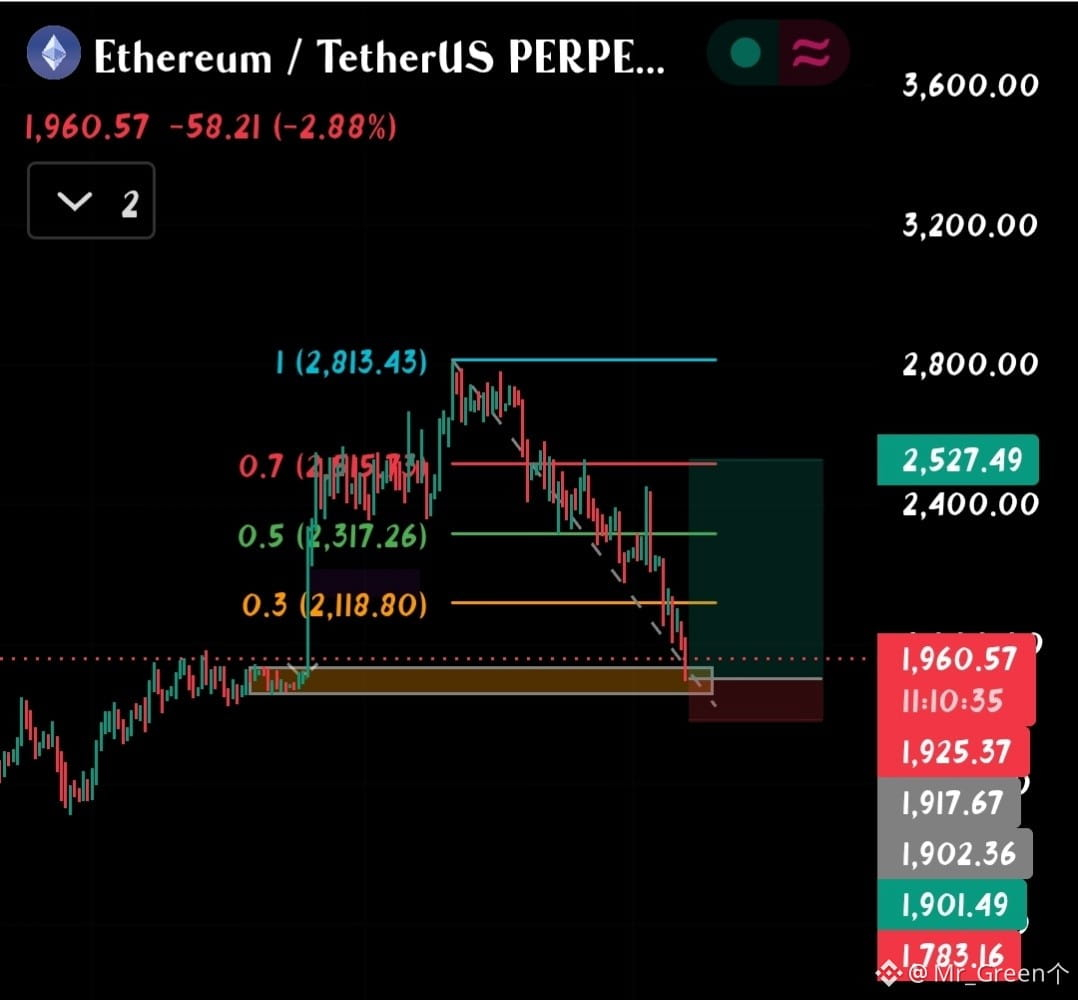
Ethereum is trading around $1,960, approaching a critical demand zone that could determine its next major move.
After reaching approximately $2,813, ETH has been consistently forming lower highs and lower lows. The bearish structure remains intact, and buyers have failed to reclaim several important Fibonacci levels.
📍 WHY THIS ZONE MATTERS
The $1,900–$1,960 area is a significant historical support zone. It previously acted as resistance before ETH's strong upward expansion. Now, price is testing whether this former resistance can become support.
📉 THE BROADER MARKET IS NOT HELPING
Institutional demand is weakening. US spot ETH ETFs recorded approximately $326M in outflows between November 4 and 10.
Even more concerning, around $259M in ETH positions were liquidated over 24 hours, with roughly 91% of those liquidations coming from LONG positions.
This tells us leveraged buyers have been under serious pressure.
🎯 MY KEY LEVELS
🟢 If buyers defend $1,900–$1,960:
First target: $2,039–$2,118
Second target: $2,200–$2,317
Major recovery resistance: $2,515–$2,527
🔴 If $1,900 breaks decisively:
First downside area: $1,850
Next target: $1,800
Further weakness could develop if the broader crypto market continues selling.
MY TAKE:
I'm watching this zone very closely. The daily RSI is already in oversold territory, so a relief bounce would not be surprising. But oversold conditions alone are not a reason to buy.
I want to see a strong rejection, a higher low, and a reclaim of nearby resistance before considering a bullish reversal.
For now, the bigger trend remains bearish. Don't confuse a temporary bounce with a confirmed trend change.
⚠️ Trade carefully. Volatility is elevated, and support can fail.
Will ETH defend $1,900, or are we heading toward $1,800?
Follow for more technical analysis and market updates.
Ethereum is trading around $1,960, approaching a critical demand zone that could determine its next major move.
After reaching approximately $2,813, ETH has been consistently forming lower highs and lower lows. The bearish structure remains intact, and buyers have failed to reclaim several important Fibonacci levels.
📍 WHY THIS ZONE MATTERS
The $1,900–$1,960 area is a significant historical support zone. It previously acted as resistance before ETH's strong upward expansion. Now, price is testing whether this former resistance can become support.
📉 THE BROADER MARKET IS NOT HELPING
Institutional demand is weakening. US spot ETH ETFs recorded approximately $326M in outflows between November 4 and 10.
Even more concerning, around $259M in ETH positions were liquidated over 24 hours, with roughly 91% of those liquidations coming from LONG positions.
This tells us leveraged buyers have been under serious pressure.
🎯 MY KEY LEVELS
🟢 If buyers defend $1,900–$1,960:
First target: $2,039–$2,118
Second target: $2,200–$2,317
Major recovery resistance: $2,515–$2,527
🔴 If $1,900 breaks decisively:
First downside area: $1,850
Next target: $1,800
Further weakness could develop if the broader crypto market continues selling.
MY TAKE:
I'm watching this zone very closely. The daily RSI is already in oversold territory, so a relief bounce would not be surprising. But oversold conditions alone are not a reason to buy.
I want to see a strong rejection, a higher low, and a reclaim of nearby resistance before considering a bullish reversal.
For now, the bigger trend remains bearish. Don't confuse a temporary bounce with a confirmed trend change.
⚠️ Trade carefully. Volatility is elevated, and support can fail.
Will ETH defend $1,900, or are we heading toward $1,800?
Follow for more technical analysis and market updates.