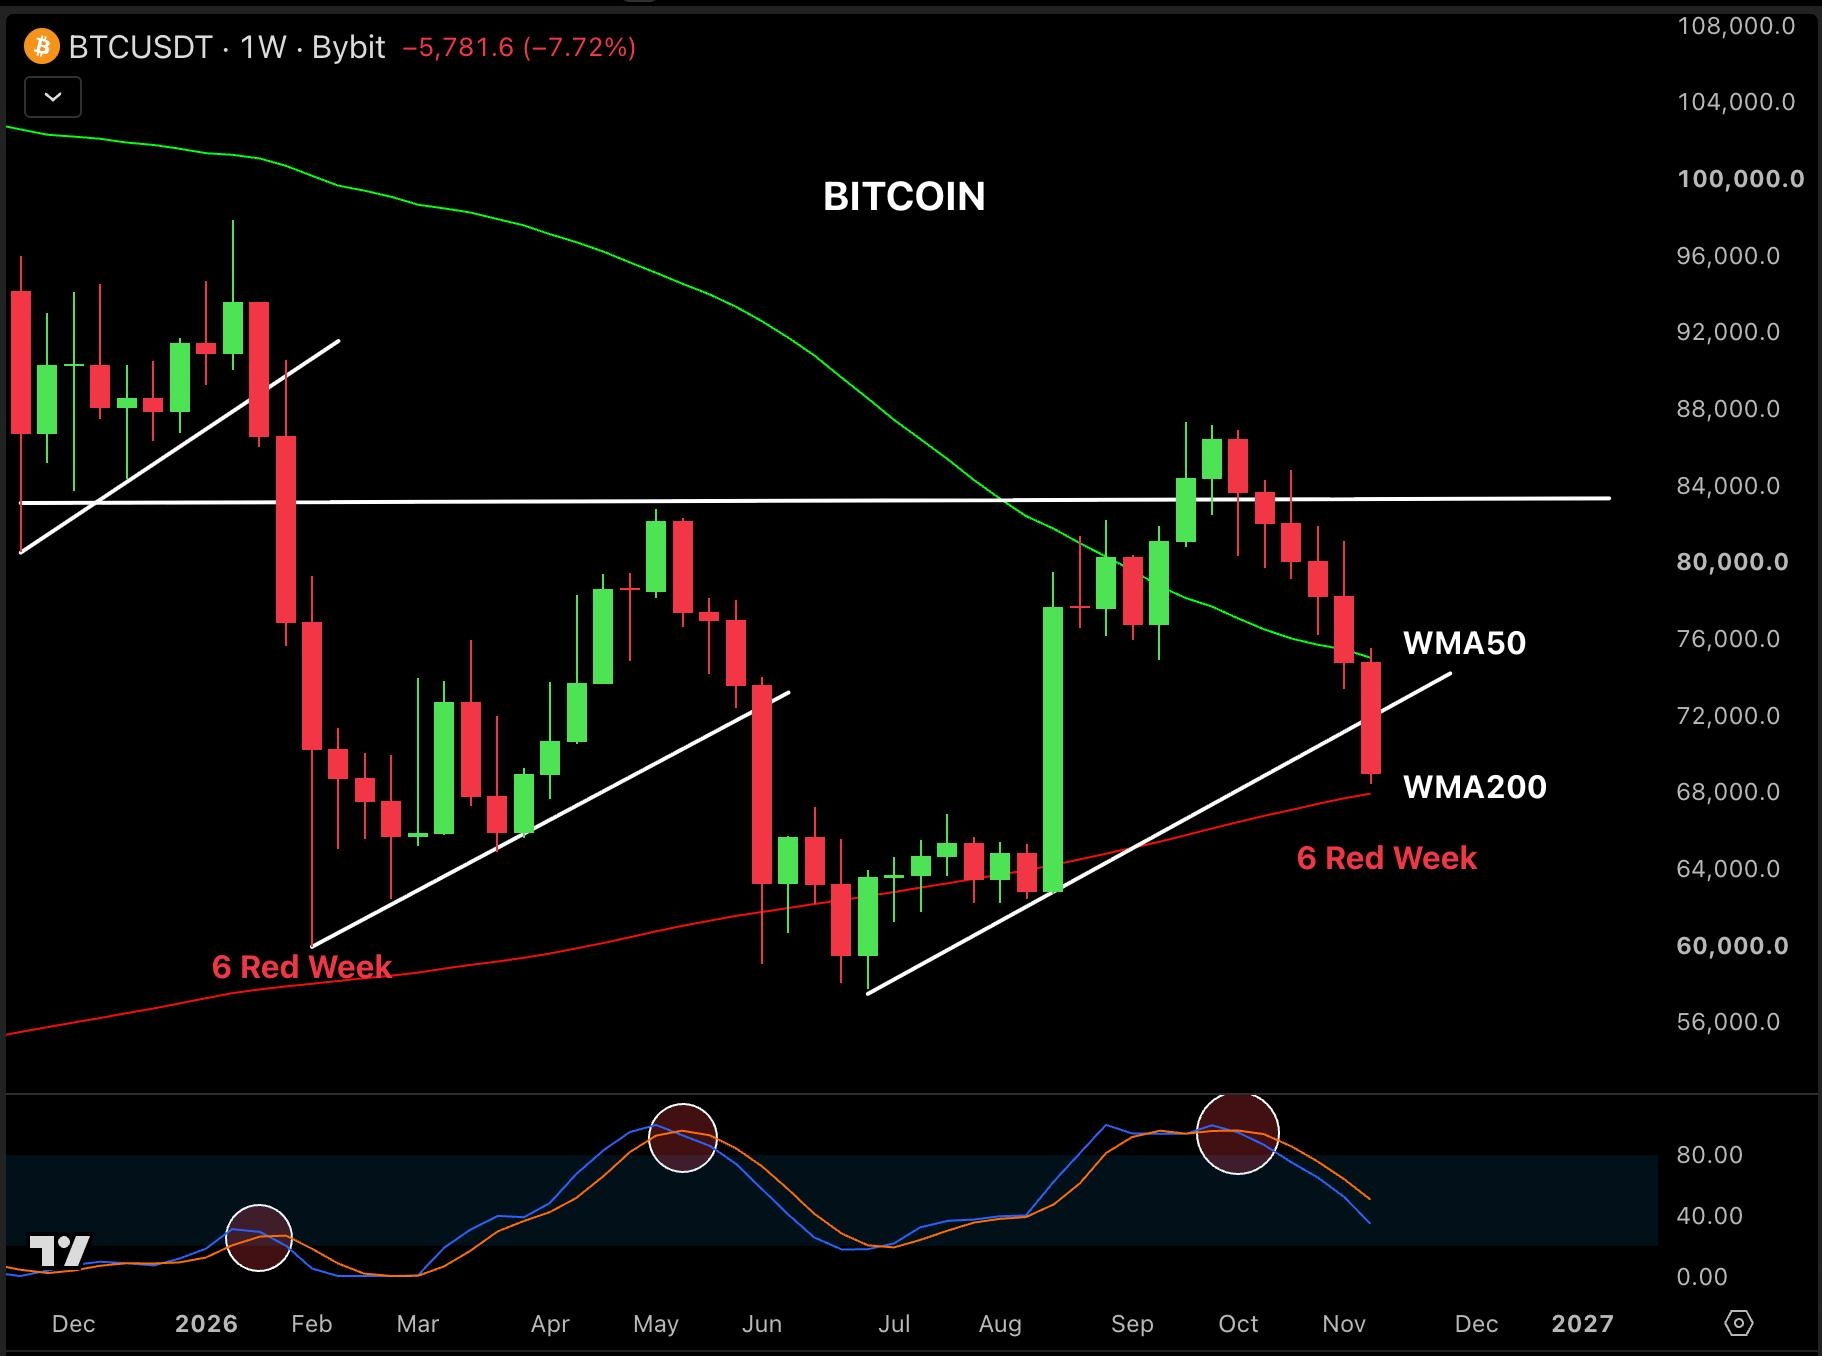

Bitcoin is approaching a critical moment, and the next weekly close could tell us a lot about what comes next.
$BTC is testing its 200-week moving average near $68,000. This is a major long-term support level, and bulls need to defend it and close the week above it to keep the bigger picture alive.
But here's something interesting about Bitcoin's history.
Midterm election periods have often brought sharp corrections, but they have also created some of the best long-term buying opportunities.
Look at the previous cycles:
2014–2017
- November 2014: $320 (Midterm)
- November 2016: $750
- November 2017: $11,000 (34x)
2018–2021
- November 2018: $3,500 (Midterm)
- November 2020: $19,000
- November 2021: $69,000 (20x)
2022–2025
- November 2022: $20,500 (Midterm)
- November 2024: $99,000
- November 2025: $111,000 (5.5x)
Now look at 2026:
- November 2026: $72,000 (Midterm)
- November 2028: ?
- November 2029: ?
If history gives us another major recovery, even a 3x move from $72,000 would put Bitcoin above $200,000.
Of course, history doesn't guarantee the future, and every cycle is different.
For now, the $68K level is the one to watch. If bulls defend it, this correction could eventually become another major opportunity for long-term investors.
The real question is: Are we watching the beginning of another accumulation phase before Bitcoin's next big move?
#JaneStreetNearlyOctuplesFidelityBitcoinETFHoldings
#HedgeFundsCMEBitcoinNetShortsFall89%
$BTC is testing its 200-week moving average near $68,000. This is a major long-term support level, and bulls need to defend it and close the week above it to keep the bigger picture alive.
But here's something interesting about Bitcoin's history.
Midterm election periods have often brought sharp corrections, but they have also created some of the best long-term buying opportunities.
Look at the previous cycles:
2014–2017
- November 2014: $320 (Midterm)
- November 2016: $750
- November 2017: $11,000 (34x)
2018–2021
- November 2018: $3,500 (Midterm)
- November 2020: $19,000
- November 2021: $69,000 (20x)
2022–2025
- November 2022: $20,500 (Midterm)
- November 2024: $99,000
- November 2025: $111,000 (5.5x)
Now look at 2026:
- November 2026: $72,000 (Midterm)
- November 2028: ?
- November 2029: ?
If history gives us another major recovery, even a 3x move from $72,000 would put Bitcoin above $200,000.
Of course, history doesn't guarantee the future, and every cycle is different.
For now, the $68K level is the one to watch. If bulls defend it, this correction could eventually become another major opportunity for long-term investors.
The real question is: Are we watching the beginning of another accumulation phase before Bitcoin's next big move?
#JaneStreetNearlyOctuplesFidelityBitcoinETFHoldings
#HedgeFundsCMEBitcoinNetShortsFall89%