$BTC: When One Signal Gets All the Spotlight
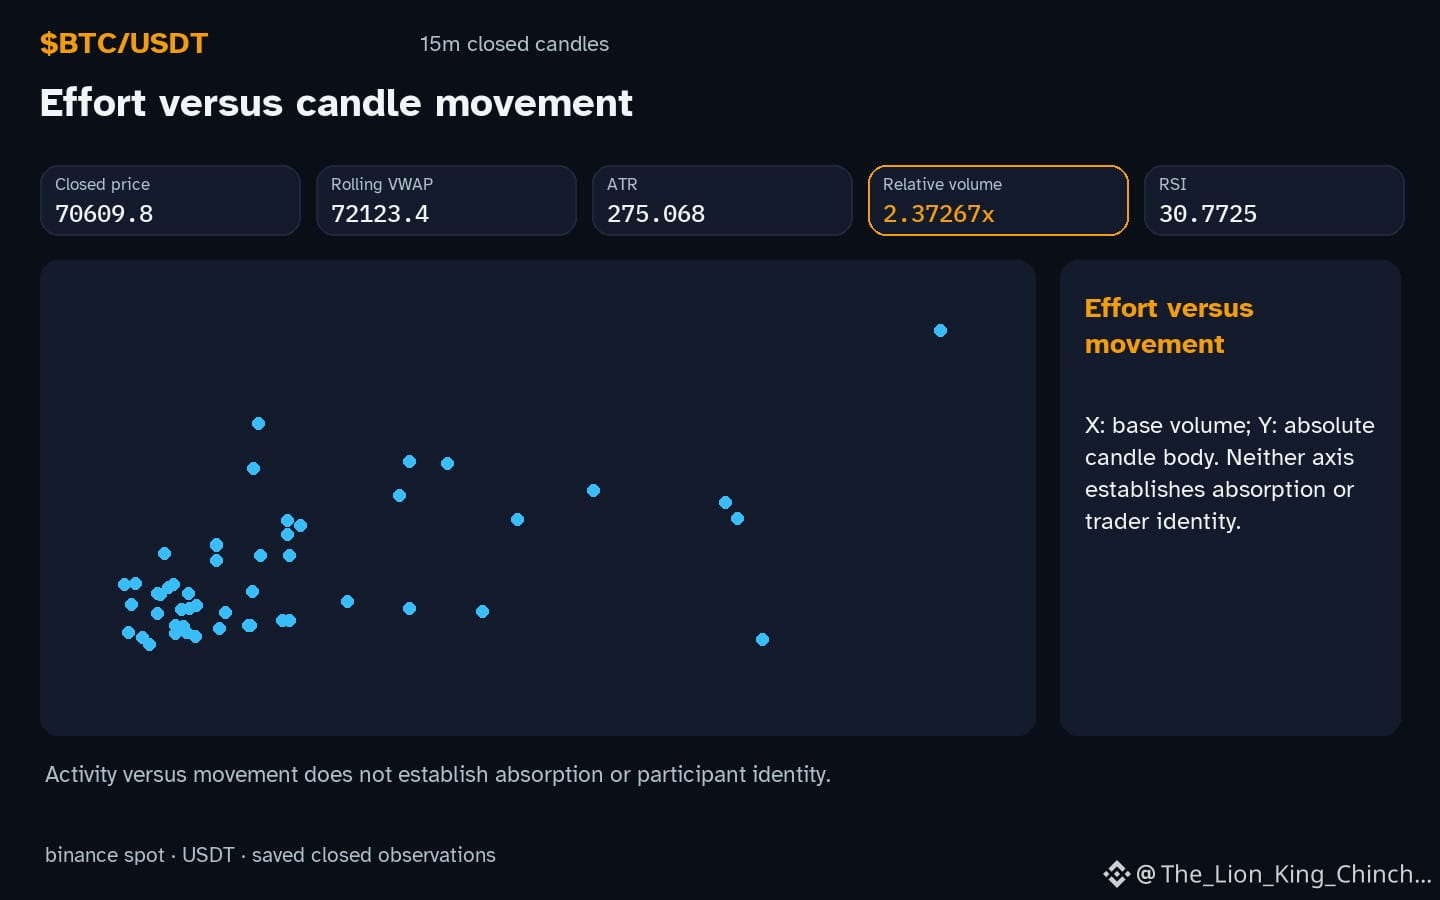
The recent observation shows $BTC trading below its local support while the hourly direction is down and volume is above baseline. Does a single metric such as a high relative volume 2.37x baseline justify a strong conviction about market sentiment?
### The question
A trader might see the volume surge and immediately label the move as a capitulation. The temptation is to treat the volume reading as a definitive sign of panic selling, ignoring other context.
### Evidence and an alternative
The candle data confirms the price is under the support level and the hourly change is -0.433576%. At the same time, the RSI reads 30.8. While a high volume can indicate strong participation, it does not reveal whether the trades are aggressive market orders or passive limit placements. An analogy is a river that appears rapid at a narrow bridge; the speed may stem from a temporary squeeze rather than a permanent change in flow. If the market is primarily filled with limit orders awaiting execution, the volume spike may simply reflect many orders crossing the same price point without a decisive shift in supply‑demand balance.
### A practical self‑check
Before treating the volume spike as a conclusive signal, compare the current RSI with its typical range and watch the next closed hourly candle. If the price holds near the support and the RSI stabilises, the high volume may have been a short‑lived imbalance. Conversely, a continued drop in price together with a falling RSI would strengthen the original hypothesis. This conditional approach keeps the analysis grounded in multiple data points rather than a single indicator.
Probabilistic market research, not a recommendation or guaranteed return.
#BTC
The recent observation shows $BTC trading below its local support while the hourly direction is down and volume is above baseline. Does a single metric such as a high relative volume 2.37x baseline justify a strong conviction about market sentiment?
### The question
A trader might see the volume surge and immediately label the move as a capitulation. The temptation is to treat the volume reading as a definitive sign of panic selling, ignoring other context.
### Evidence and an alternative
The candle data confirms the price is under the support level and the hourly change is -0.433576%. At the same time, the RSI reads 30.8. While a high volume can indicate strong participation, it does not reveal whether the trades are aggressive market orders or passive limit placements. An analogy is a river that appears rapid at a narrow bridge; the speed may stem from a temporary squeeze rather than a permanent change in flow. If the market is primarily filled with limit orders awaiting execution, the volume spike may simply reflect many orders crossing the same price point without a decisive shift in supply‑demand balance.
### A practical self‑check
Before treating the volume spike as a conclusive signal, compare the current RSI with its typical range and watch the next closed hourly candle. If the price holds near the support and the RSI stabilises, the high volume may have been a short‑lived imbalance. Conversely, a continued drop in price together with a falling RSI would strengthen the original hypothesis. This conditional approach keeps the analysis grounded in multiple data points rather than a single indicator.
Probabilistic market research, not a recommendation or guaranteed return.
#BTC