
$INIT Is Showing a Recovery Attempt After a Sharp Sell-Off — Can Bulls Reclaim $0.12?
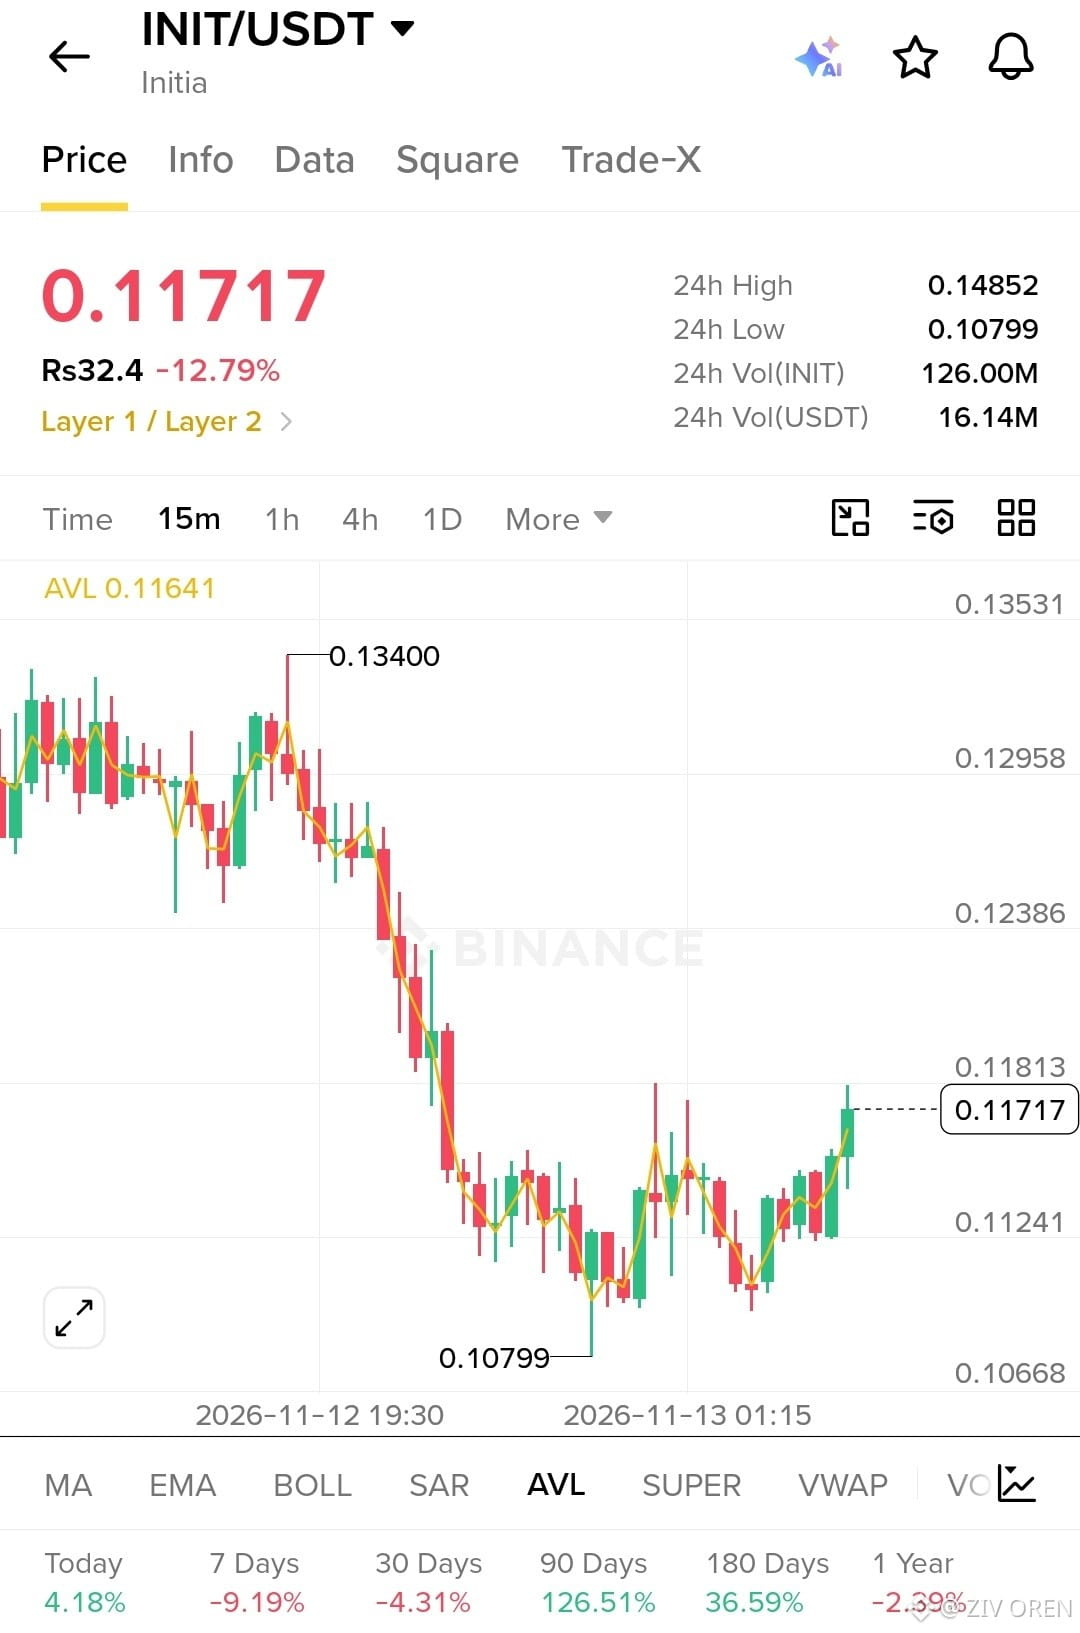
INIT is trading around $0.11717 on the 15-minute chart, down 12.79% over 24 hours. After dropping from the $0.13400 area to a low of $0.10799, I’m watching whether this recovery can develop into a stronger reversal or simply become another relief bounce.
The first resistance I’m watching is $0.11813, followed by the $0.12386 zone. A clean breakout with strong buying pressure could open the door for further recovery. On the downside, $0.11241 is an important nearby support, while $0.10799 remains the key low bulls need to defend.
24-hour trading volume stands at 126M INIT, equivalent to approximately $16.14M in USDT volume. That confirms meaningful trading activity, but the available chart doesn’t establish whether buyers are taking control yet.
My Trading Plan: I’m not rushing into a position after such a sharp decline. I’d prefer to see INIT hold above $0.11241 and reclaim $0.11813 with convincing volume before considering a spot entry. For DCA, I’d watch the $0.11241 area and the $0.10800–$0.11000 zone only if price stabilizes and shows a clear reaction from support. A sustained move below $0.10799 would invalidate this recovery setup for me.
The next move around $0.11813 matters. If buyers break resistance and hold it as support, INIT could build a stronger recovery. If they fail, I’ll stay cautious and wait for a better setup rather than chase the bounce.
INIT is trading around $0.11717 on the 15-minute chart, down 12.79% over 24 hours. After dropping from the $0.13400 area to a low of $0.10799, I’m watching whether this recovery can develop into a stronger reversal or simply become another relief bounce.
The first resistance I’m watching is $0.11813, followed by the $0.12386 zone. A clean breakout with strong buying pressure could open the door for further recovery. On the downside, $0.11241 is an important nearby support, while $0.10799 remains the key low bulls need to defend.
24-hour trading volume stands at 126M INIT, equivalent to approximately $16.14M in USDT volume. That confirms meaningful trading activity, but the available chart doesn’t establish whether buyers are taking control yet.
My Trading Plan: I’m not rushing into a position after such a sharp decline. I’d prefer to see INIT hold above $0.11241 and reclaim $0.11813 with convincing volume before considering a spot entry. For DCA, I’d watch the $0.11241 area and the $0.10800–$0.11000 zone only if price stabilizes and shows a clear reaction from support. A sustained move below $0.10799 would invalidate this recovery setup for me.
The next move around $0.11813 matters. If buyers break resistance and hold it as support, INIT could build a stronger recovery. If they fail, I’ll stay cautious and wait for a better setup rather than chase the bounce.